Technical analysis
Citibank Wave Analysis – 25 November, 2019
November 25, 2019 @ 17:24 +03:00
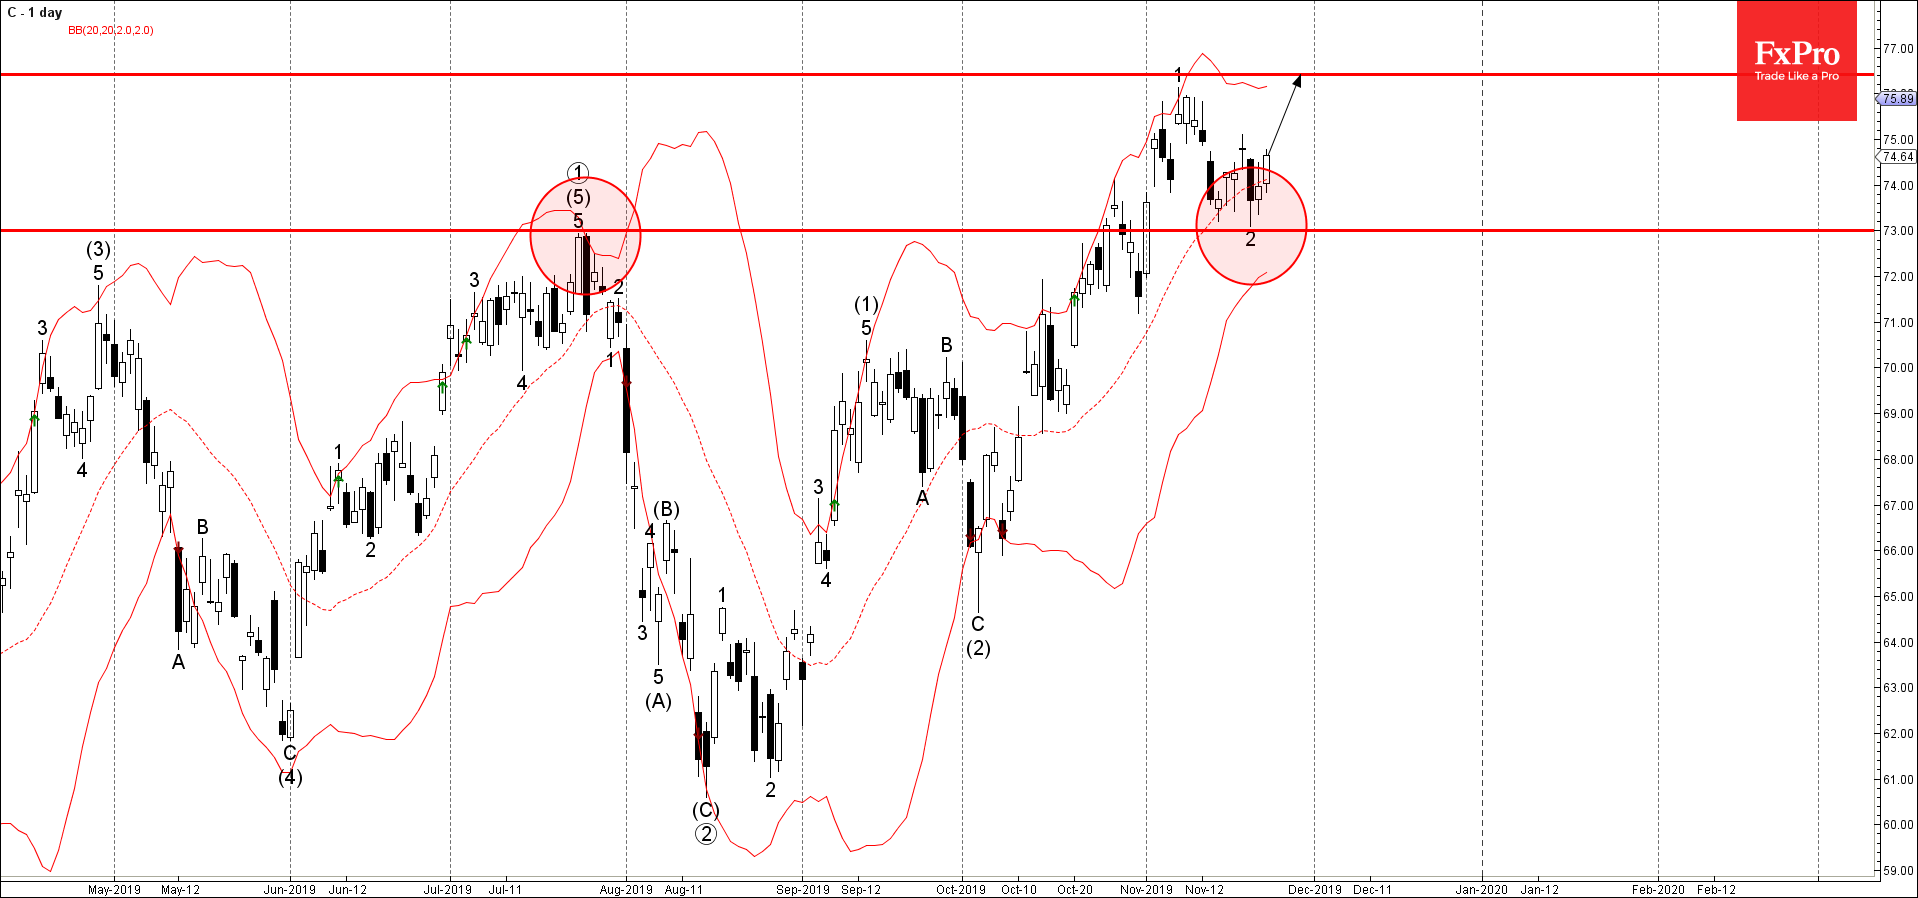
- Citibank reversed from support area
- Likely to rise to 76.00
Citibank recently reversed up from the support area lying between the key support level 73.00 (former multi-month high from July) and the lower daily Bollinger Band.
The upward reversal from this support area created the daily candlesticks reversal pattern Morning Star.
Citibank is expected to rise further in the active impulse wave 3 toward the next resistance level 76.00 (top of the previous impulse wave 1).