Technical analysis
AUDCAD Wave Analysis – 06 November , 2018
November 06, 2018 @ 16:12 +03:00
• AUDCAD reversed from support area • Further gains are likely
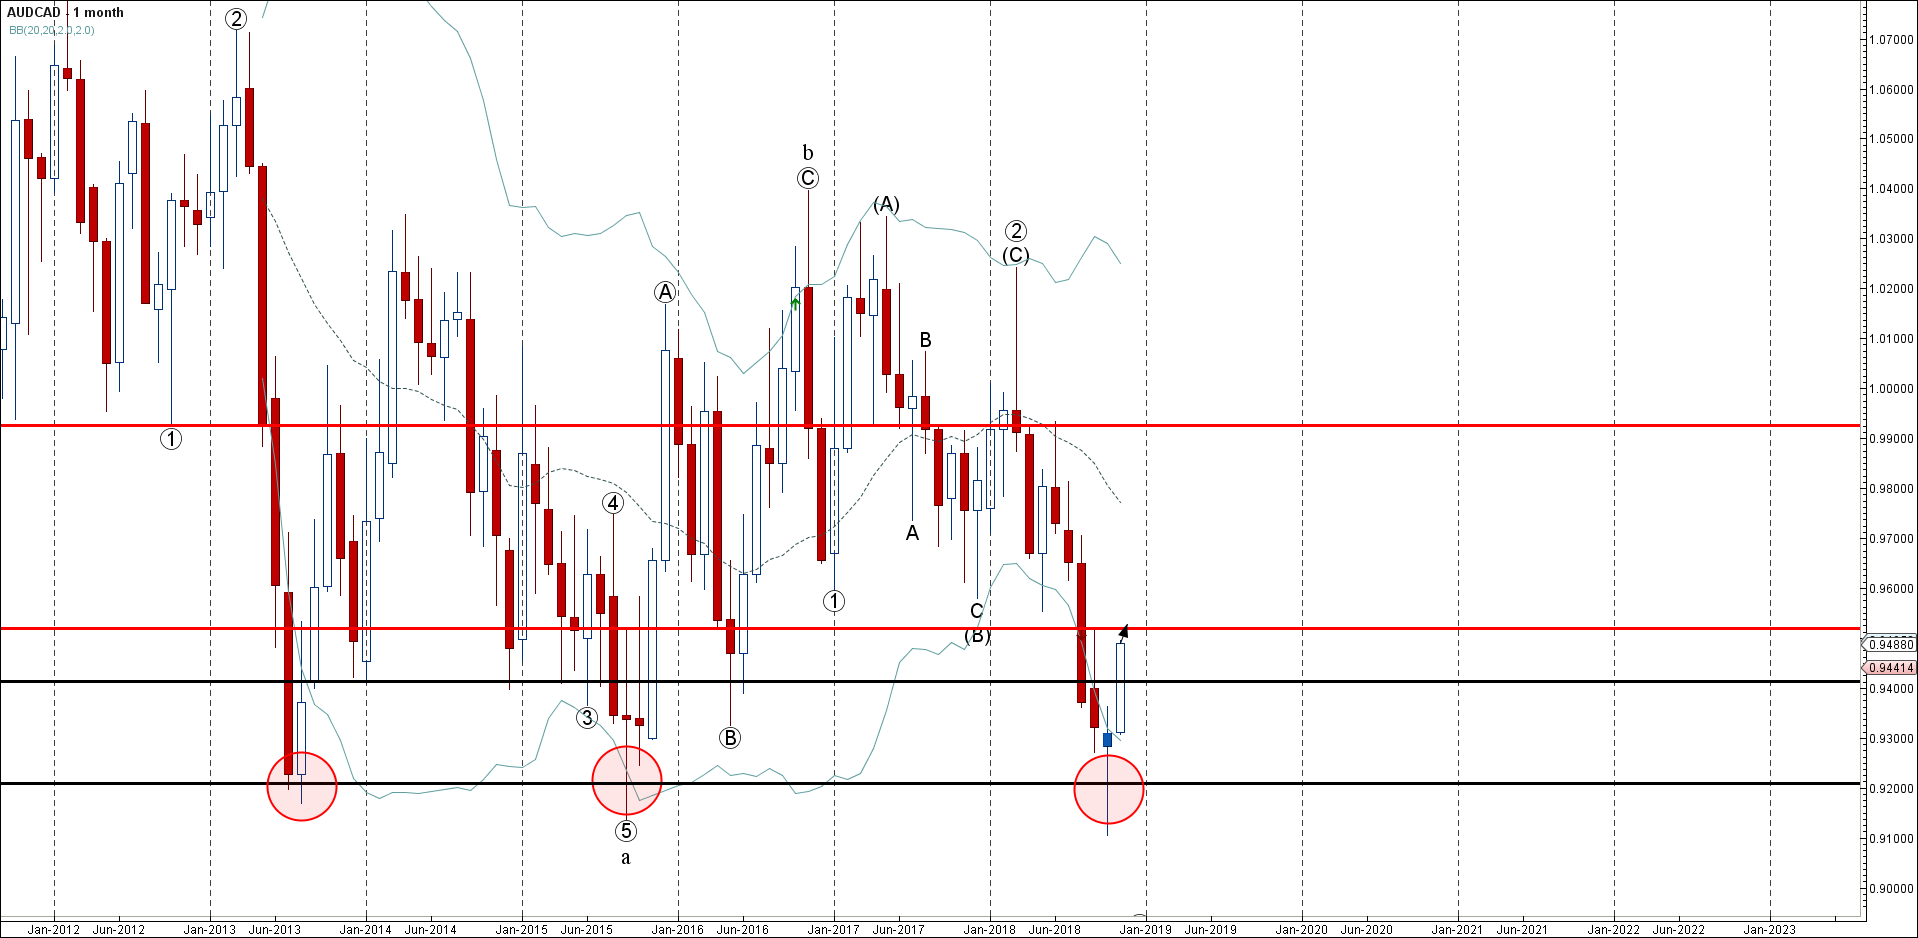
AUDCAD continues to rise inside the weekly upward impulse wave – which started previously – when the price reversed up sharply from the major support area lying between the multi- support level 0.9200 and the lower monthly Bollinger Band.
The upward reversal from this support area created the strong monthly Japanese candlesticks reversal pattern Hammer (highlighted below).
AUDCAD is like to rise further and re-test the next resistance level 0.9520 (previous monthly high from September).


