Technical analysis
Alibaba Wave Analysis – 26 February, 2020
February 26, 2020 @ 18:10 +03:00
- Alibaba reversed from support area
- Likely to rise to 220.00
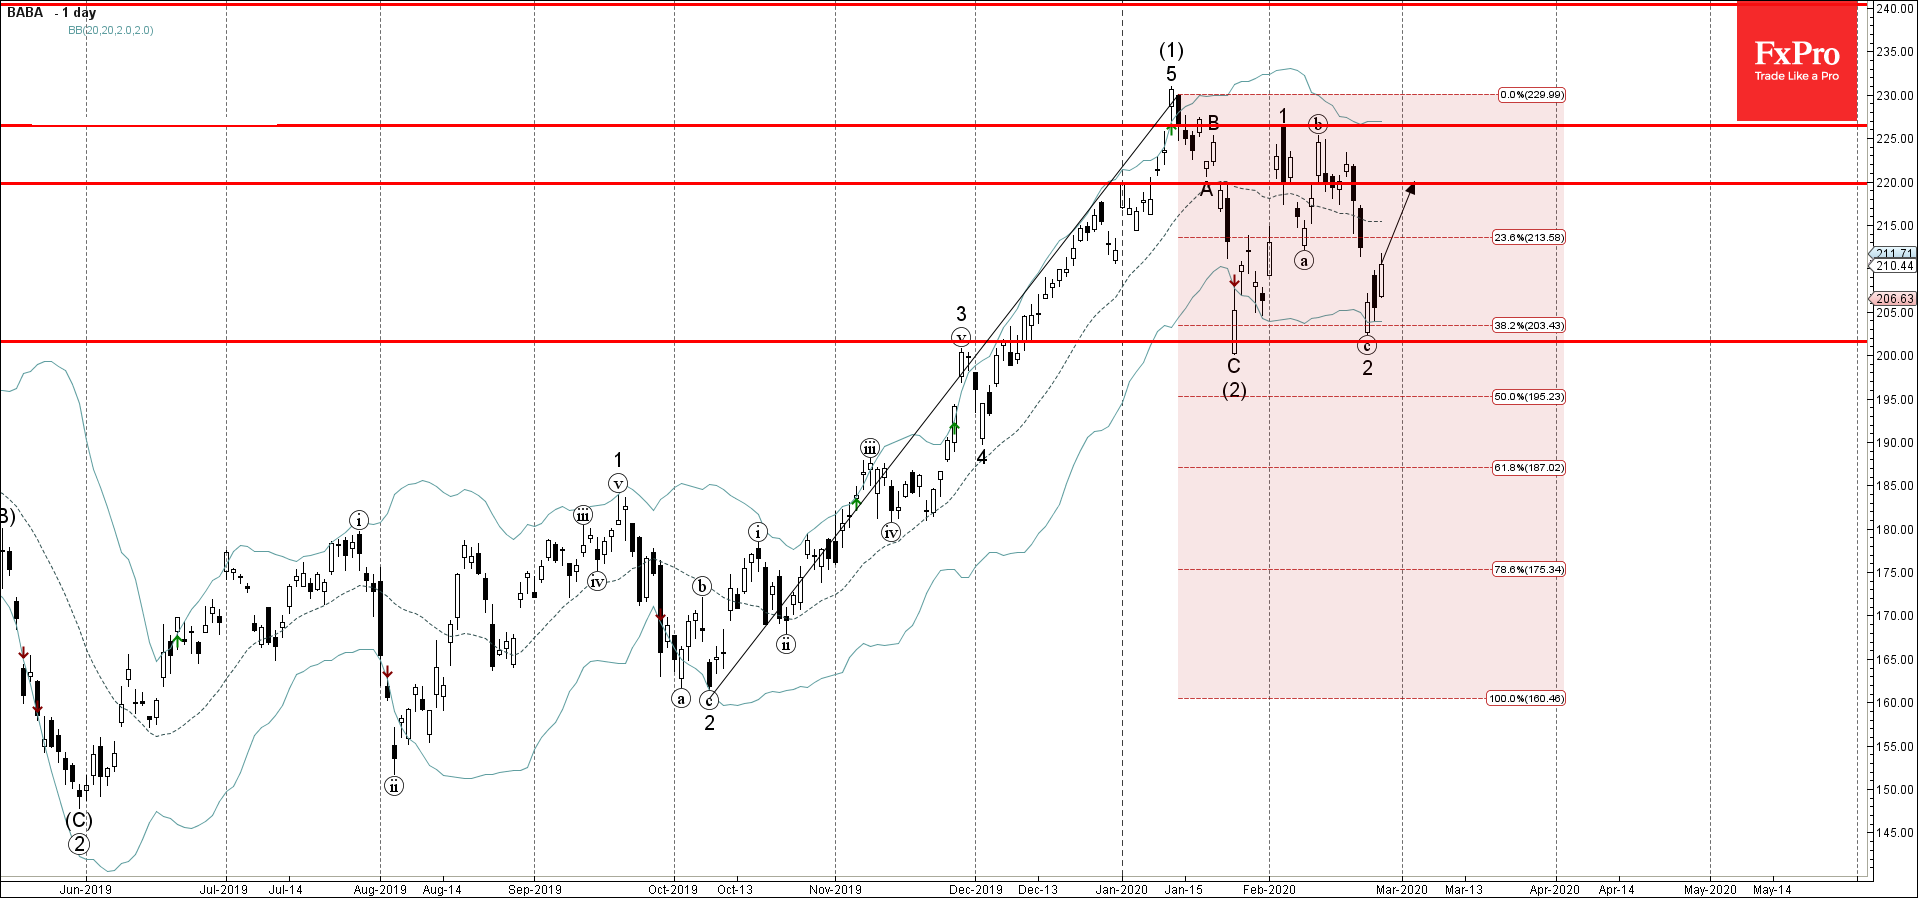
Alibaba recently reversed up from the support area lying between the pivotal support level 200.00 (low of the previous correction (2)), lower daily Bollinger Band and 38.2% Fibonacci retracement of the previous upward impulse from October.
The upward reversal from this support area started the active short-term impulse wave 3 of the longer-term impulse wave (3).
Given the clear daily uptrend – Alibaba is likely to rise further toward the next resistance level 220.00.