


Technical analysis
Airbnb Wave Analysis – 15 April 2026
April 15, 2026 @ 18:14 +03:00
Airbnb: ⬆️ Buy
– Airbnb broke daily Triangle
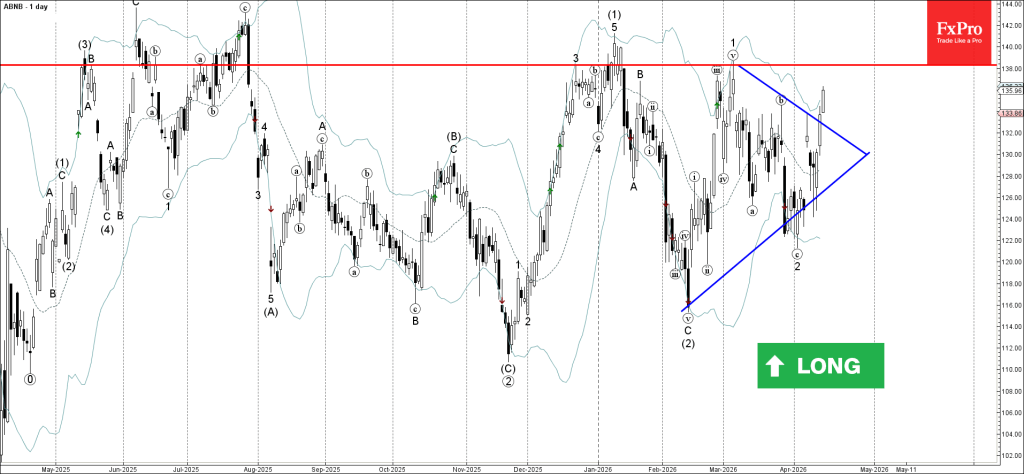
– Likely to rise to resistance level 138.00
Airbnb recently broke the resistance trendline of the daily Triangle from the middle of February, as can be seen from the daily Airbnb chart below.
The breakout of this daily Triangle accelerated the active impulse wave 3 of the intermediate impulse wave (3) from the start of February.

Airbnb can be expected to rise toward the next resistance level 138.00 (top of wave 1, which is also the apex of this Triangle).