

Technical analysis
WTI Wave Analysis – 22 January, 2019
January 22, 2019 @ 17:07 +03:00

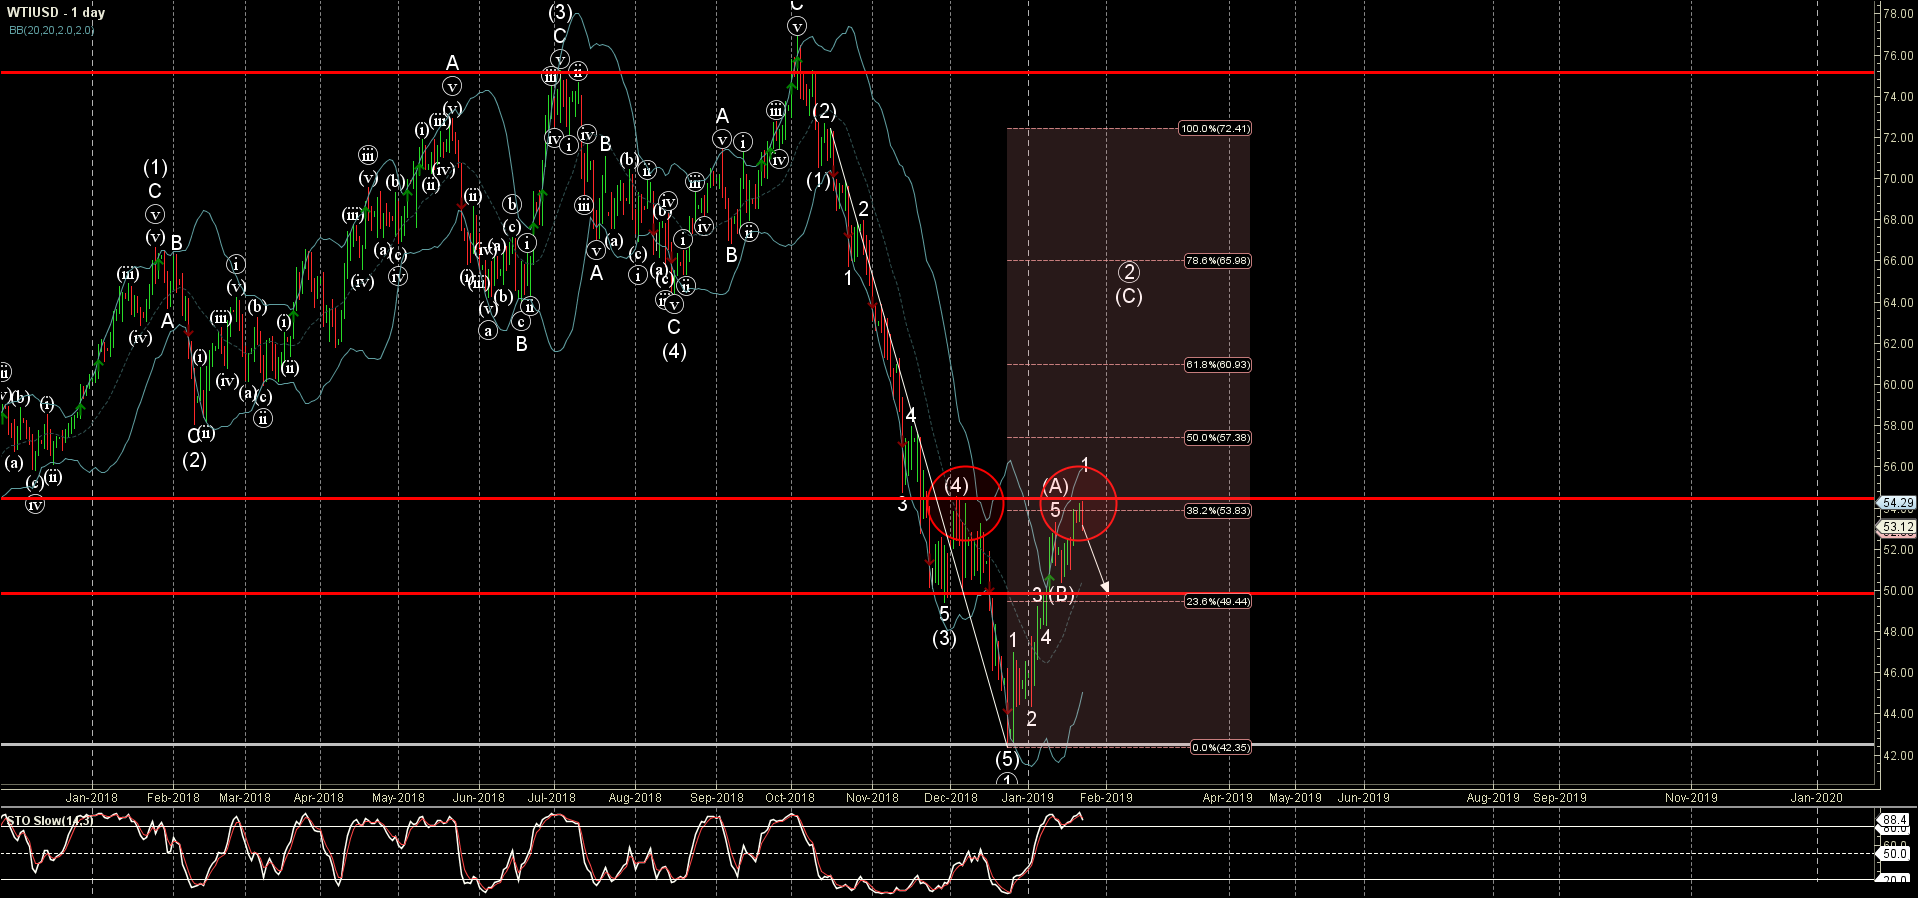
- WTI reversed from resistance zone
- Further losses are likely
WTI recently reversed down from the resistance area lying between the pivotal resistance level 54.50 (which stopped the previous correction (4) in December), upper daily Bollinger Band and the 38.2% Fibonacci correction of the earlier downward impulse from October.
The downward reversal from this resistance area stopped the previous medium-term upward impulse wave (C) from the start of January.
Considering the overbought reading on the daily Stochastic indicator – WTI is likely to correct down further and re-test the next round support level 50.00 (low of wave (B)).
Related Articles

EURGBP Wave Analysis 24 April 2024
April 24, 2024 @ 21:42 +03:00

EURJPY Wave Analysis 24 April 2024
April 24, 2024 @ 21:40 +03:00

WTI crude oil Wave Analysis 23 April 2024
April 23, 2024 @ 22:47 +03:00

USDCAD Wave Analysis 23 April 2024
April 23, 2024 @ 22:46 +03:00