

Technical analysis
WTI Wave Analysis – 18 June, 2019
June 18, 2019 @ 18:11 +03:00

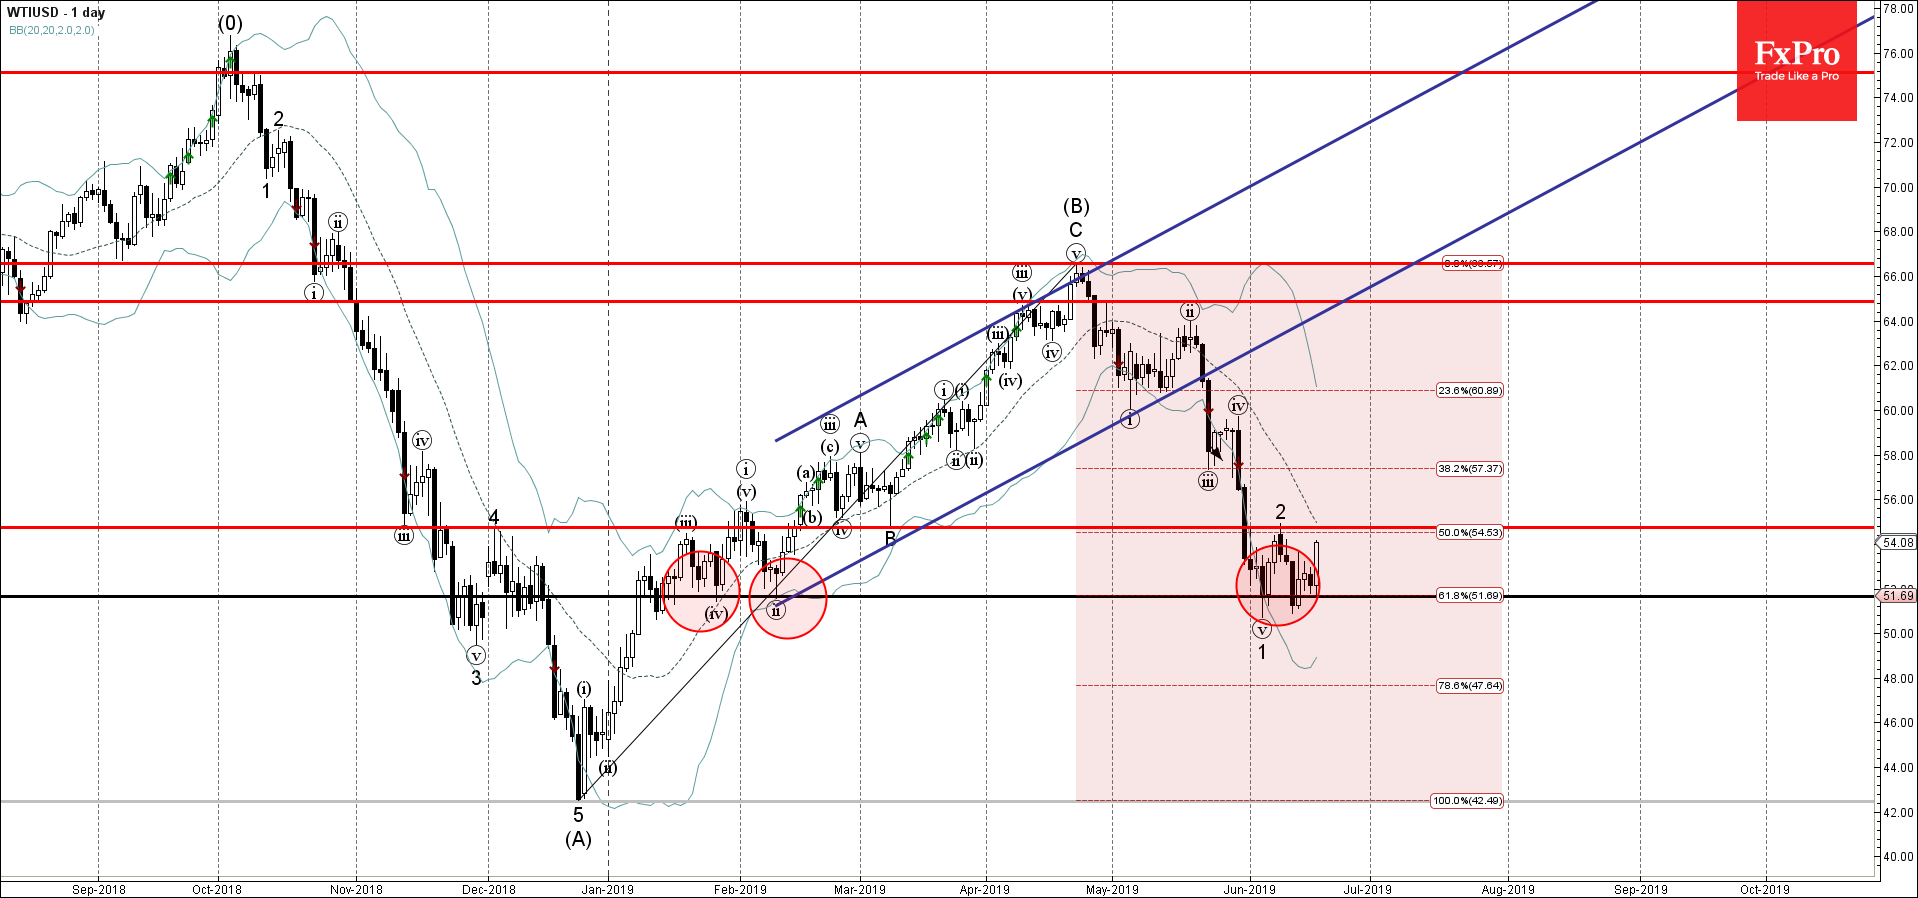
- WTI reversed from support area
- Further gains are likely
WTI recently reversed up sharply from the support area lying between the multi-month support level 51.70 (which has been reversing the price from January), 61.8% Fibonacci correction of the previous upward impulse from February and the lower daily Bollinger Band.
The upward reversal from this support area stopped the earlier short-term impulse wave 3 from the start of June.
WTI is expected to rise further and retest the next resistance level 54.75 (top of the previous short-term correction 2).
Related Articles

EURJPY Wave Analysis 18 April 2024
April 18, 2024 @ 23:09 +03:00

EURUSD Wave Analysis 18 April 2024
April 18, 2024 @ 23:08 +03:00

WTI Wave Analysis 17 April 2024
April 17, 2024 @ 22:40 +03:00

EURGBP Wave Analysis 17 April 2024
April 17, 2024 @ 22:38 +03:00