

WTI Wave Analysis – 09 Janaury, 2019
January 09, 2019 @ 14:34 +03:00

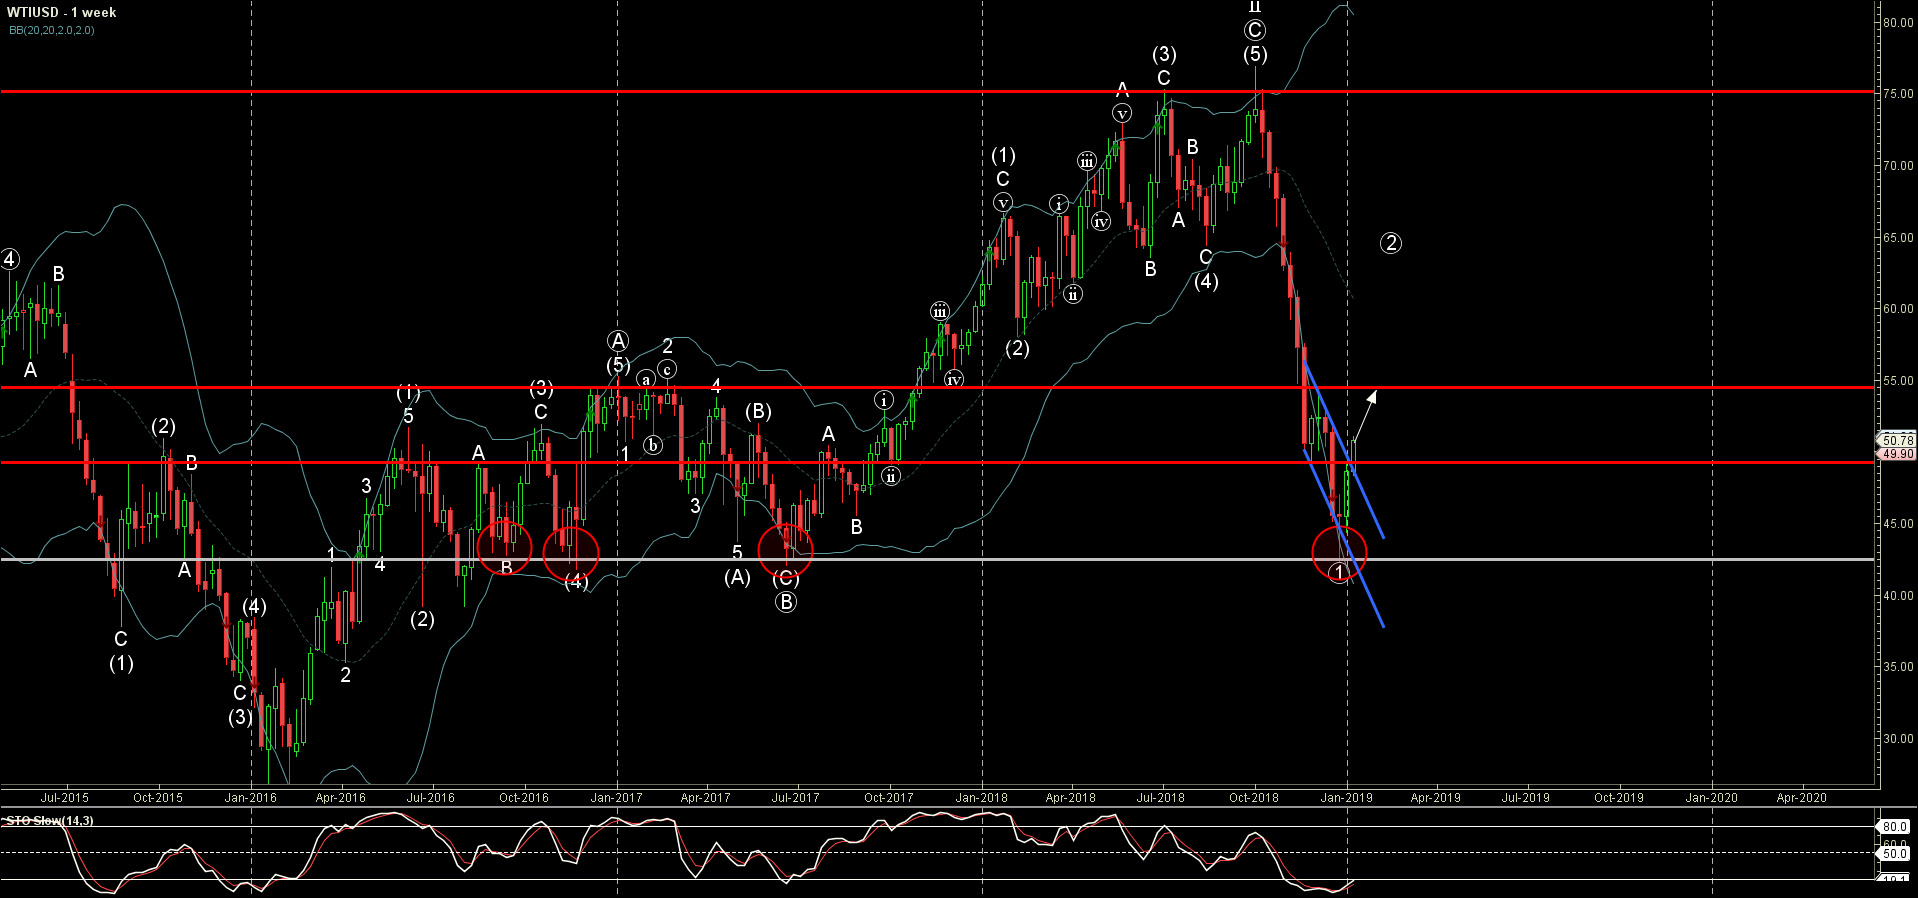
- WTI rising inside corrective wave ②
- Further gains are likely
WTI continues to rise inside the long-term corrective wave ② which started previously from the support area lying between the long-term support level 42.50 (which has been reversing the price from 2016), lower weekly Bollinger Band and the support trendline of the weekly down channel from the end of 2018.
The price recently broke though the round resistance level 50.00 and the resistance trendline of the daily down channel from last year – which should strengthen the bullish pressure on WTI.
Given the oversold weekly Stochastic indicator – WTI is expected to rise further and re-test the next key resistance level 55.00.

April 25, 2024 @ 20:10 +03:00

April 25, 2024 @ 20:09 +03:00

April 24, 2024 @ 21:42 +03:00

April 24, 2024 @ 21:40 +03:00