

Technical analysis
Wheat Wave Analysis – 27 March, 2019
March 27, 2019 @ 17:56 +03:00

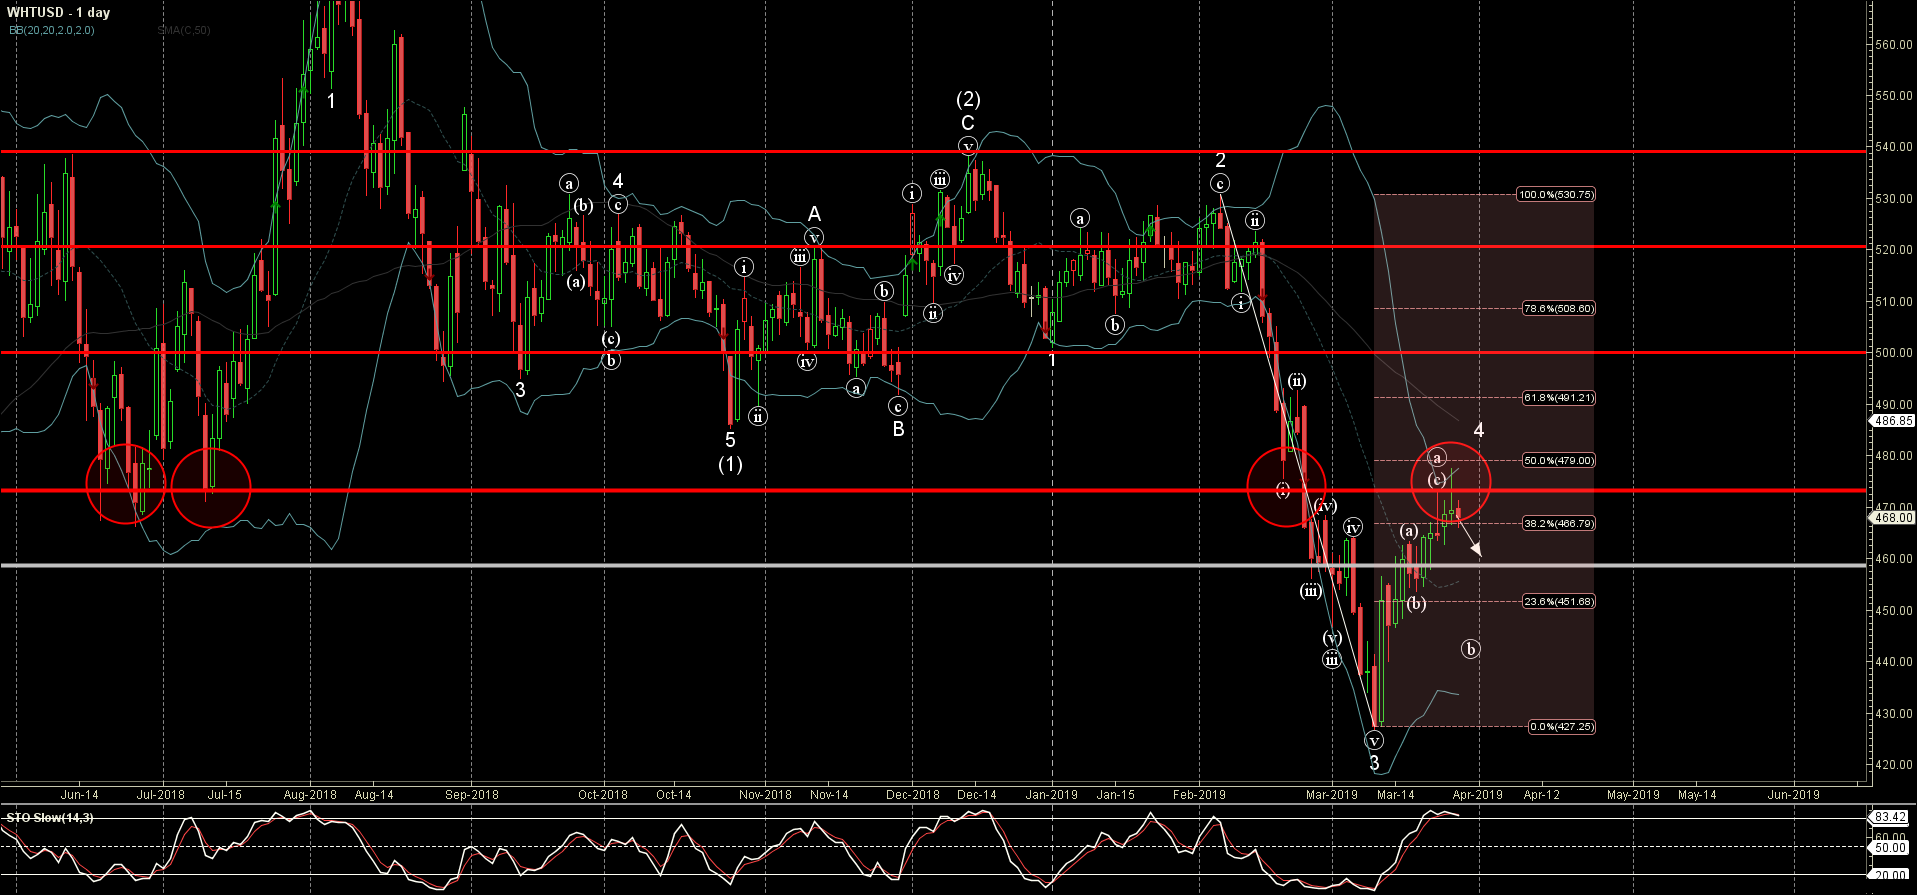
- Wheat reversed from resistance area
- Further losses are likely
Wheat recently reversed down from the resistance area lying between the key resistance level 470.00 (former powerful support from 2018), upper daily Bollinger Band and the 38.2% Fibonacci correction of the downward impulse from February.
The downward reversal from this resistance area created the daily Japanese candlesticks reversal pattern Shooting Star.
With the overbought Stochastic indicator – Wheat is expected to fall further and re-test the next support level 460.00.
Related Articles

WTI crude oil Wave Analysis 23 April 2024
April 23, 2024 @ 22:47 +03:00

USDCAD Wave Analysis 23 April 2024
April 23, 2024 @ 22:46 +03:00

Intel Wave Analysis 19 April 2024
April 19, 2024 @ 22:12 +03:00

GBPUSD Wave Analysis 19 April 2024
April 19, 2024 @ 22:11 +03:00