

Technical analysis
USDCAD Wave Analysis – 14 January, 2019
January 14, 2019 @ 16:07 +03:00
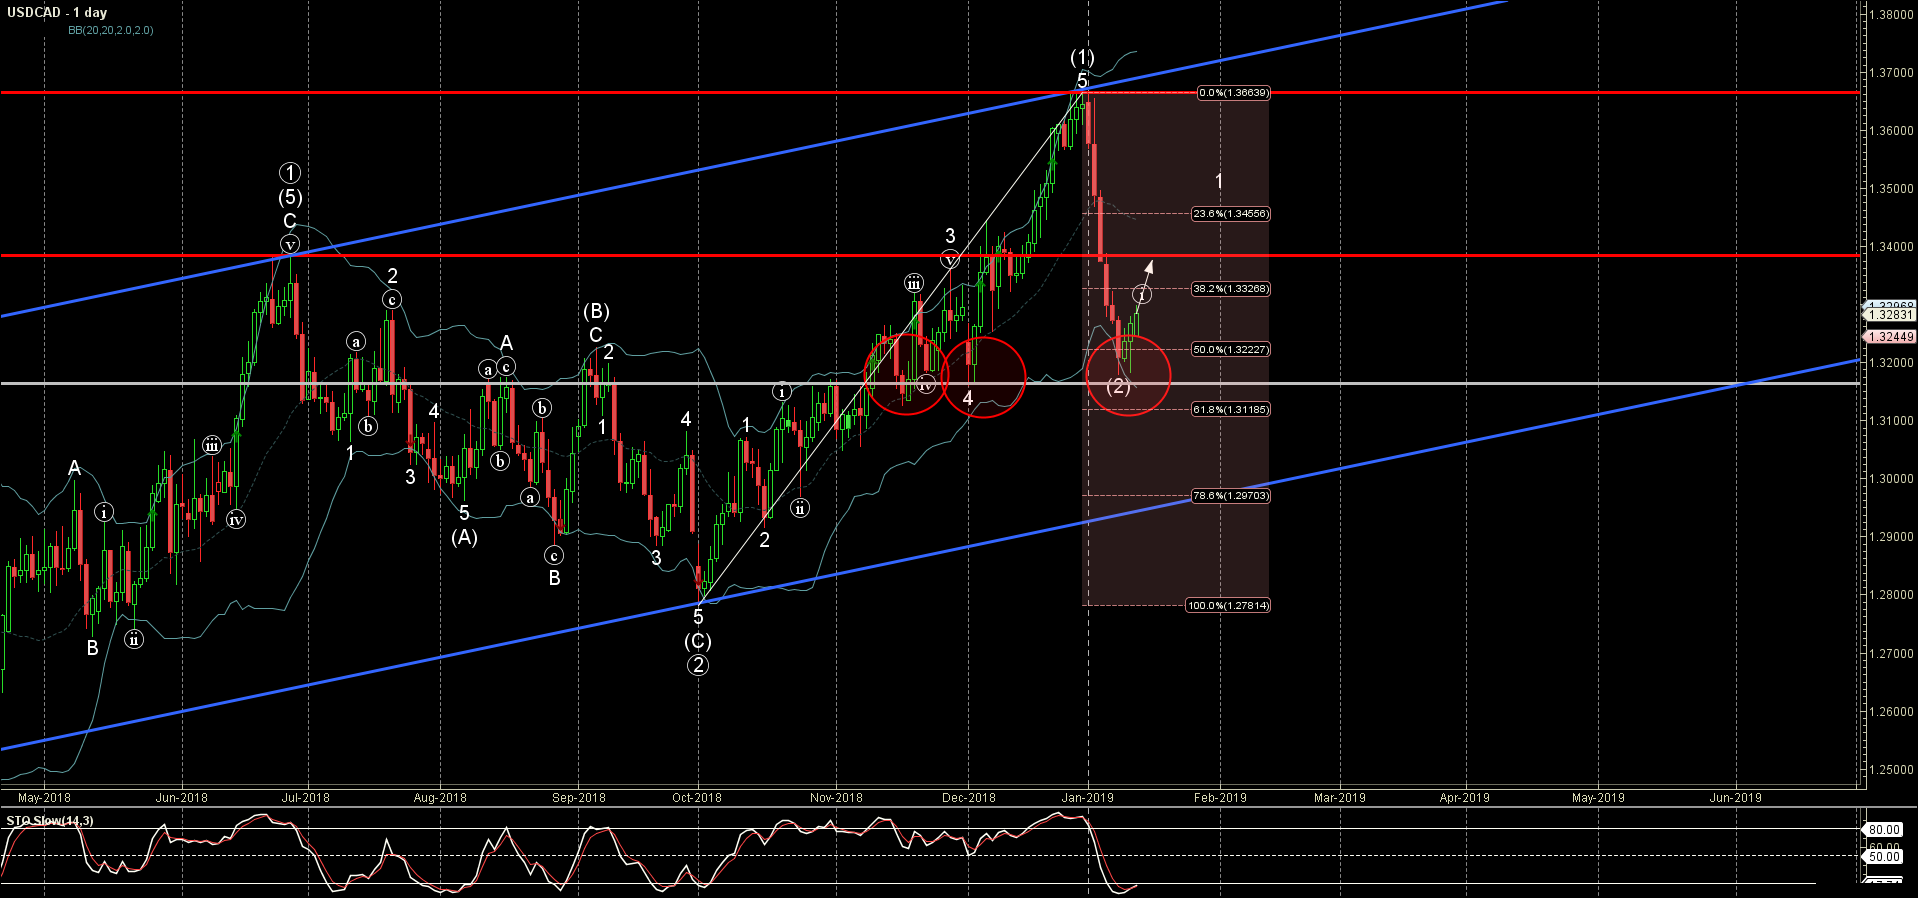
- USDCAD reversed from support area
- Further gains are likely
USDCAD recently reversed up from the support area lying between the strong support level 1.3160 (which also reversed the price in November and December), lower daily Bollinger Band and the 50% Fibonacci correction of the previous upward impulse (1) from September.
The upward reversal from this support area started the active medium-term impulse wave (3) – which belongs to the longer-term upward impulse sequence ③ from October.
With the daily Stochastic still moving in the oversold territory – USDCAD is expected to rise further and re-test the next resistance level 1.3400.
Related Articles

EURGBP Wave Analysis 24 April 2024
April 24, 2024 @ 21:42 +03:00

EURJPY Wave Analysis 24 April 2024
April 24, 2024 @ 21:40 +03:00

WTI crude oil Wave Analysis 23 April 2024
April 23, 2024 @ 22:47 +03:00

USDCAD Wave Analysis 23 April 2024
April 23, 2024 @ 22:46 +03:00