

Technical analysis
Sugar Wave Analysis – 10 Janaury, 2019
January 10, 2019 @ 16:09 +03:00

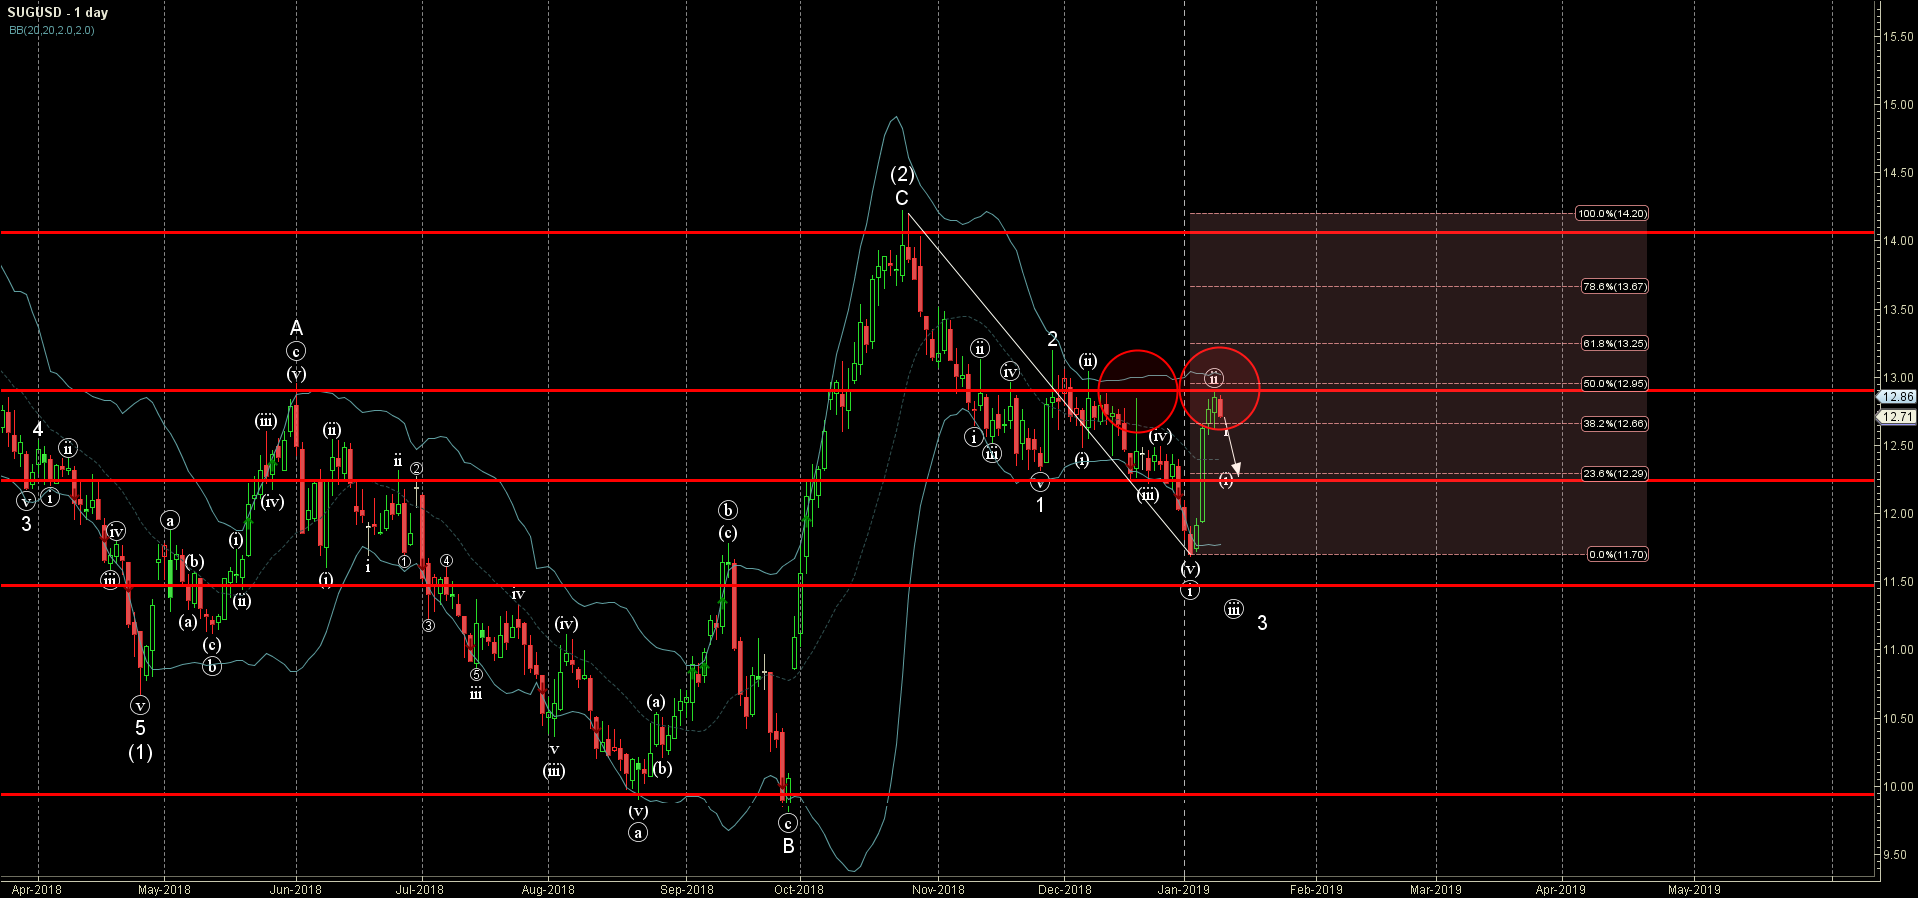
- Sugar reversed from resistance area
- Further losses are likely
Sugar recently reversed down from the resistance area lying between the key resistance level 12.90 (which reversed the price with the daily Falling Star in December) and the upper daily Bollinger Band.
The downward reversal from this resistance area started the active short-term impulse wave (i) – which belongs to wave 3 from the end of November.
Sugar is expected to fall further and re-test the next support level 12.25 (target price for the completion of the active impulse wave (i)).
Related Articles

EURJPY Wave Analysis 18 April 2024
April 18, 2024 @ 23:09 +03:00

EURUSD Wave Analysis 18 April 2024
April 18, 2024 @ 23:08 +03:00

WTI Wave Analysis 17 April 2024
April 17, 2024 @ 22:40 +03:00

EURGBP Wave Analysis 17 April 2024
April 17, 2024 @ 22:38 +03:00