

Technical analysis
Sugar Wave Analysis – 03 Janaury, 2019
January 03, 2019 @ 19:05 +03:00

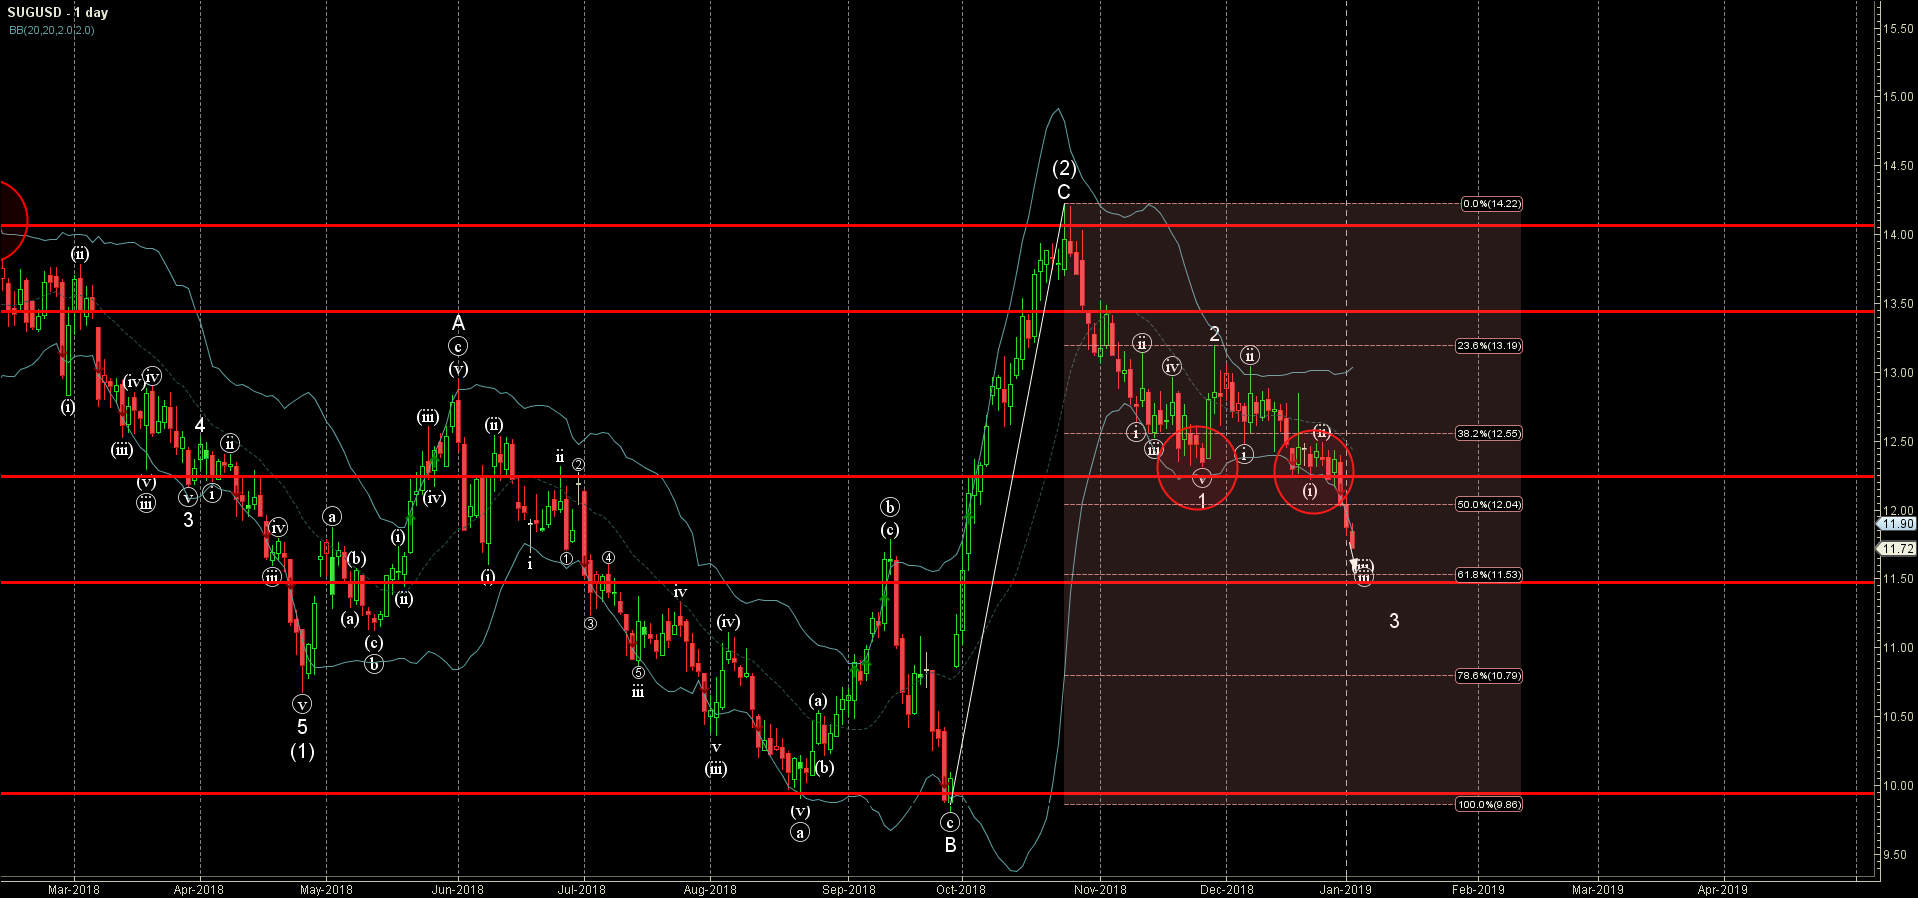
- Sugar broke support area
- Further losses are likely
Sugar recently broke through the support area lying between the key support level 12.20 (which has been reversing the price from the end of November) and the 50% Fibonacci correction of the previous sharp C-wave from September.
The breakout of this support area accelerated the active short-term impulse wave 3 of the medium-term impulse wave (3) from the end of October.
Sugar is expected to fall further and re-test the next support level 11.50 (target price for the completion of the active impulse wave (iii)).
Related Articles

S&P 500 Wave Analysis 15 April 2024
April 16, 2024 @ 00:44 +03:00

EURUSD Wave Analysis 15 April 2024
April 16, 2024 @ 00:44 +03:00

USDCAD Wave Analysis 12 April 2024
April 12, 2024 @ 23:11 +03:00

GBPAUD Wave Analysis 12 April 2024
April 12, 2024 @ 23:10 +03:00