

Technical analysis
Soy Wave Analysis – 07 February, 2019
February 07, 2019 @ 18:39 +03:00

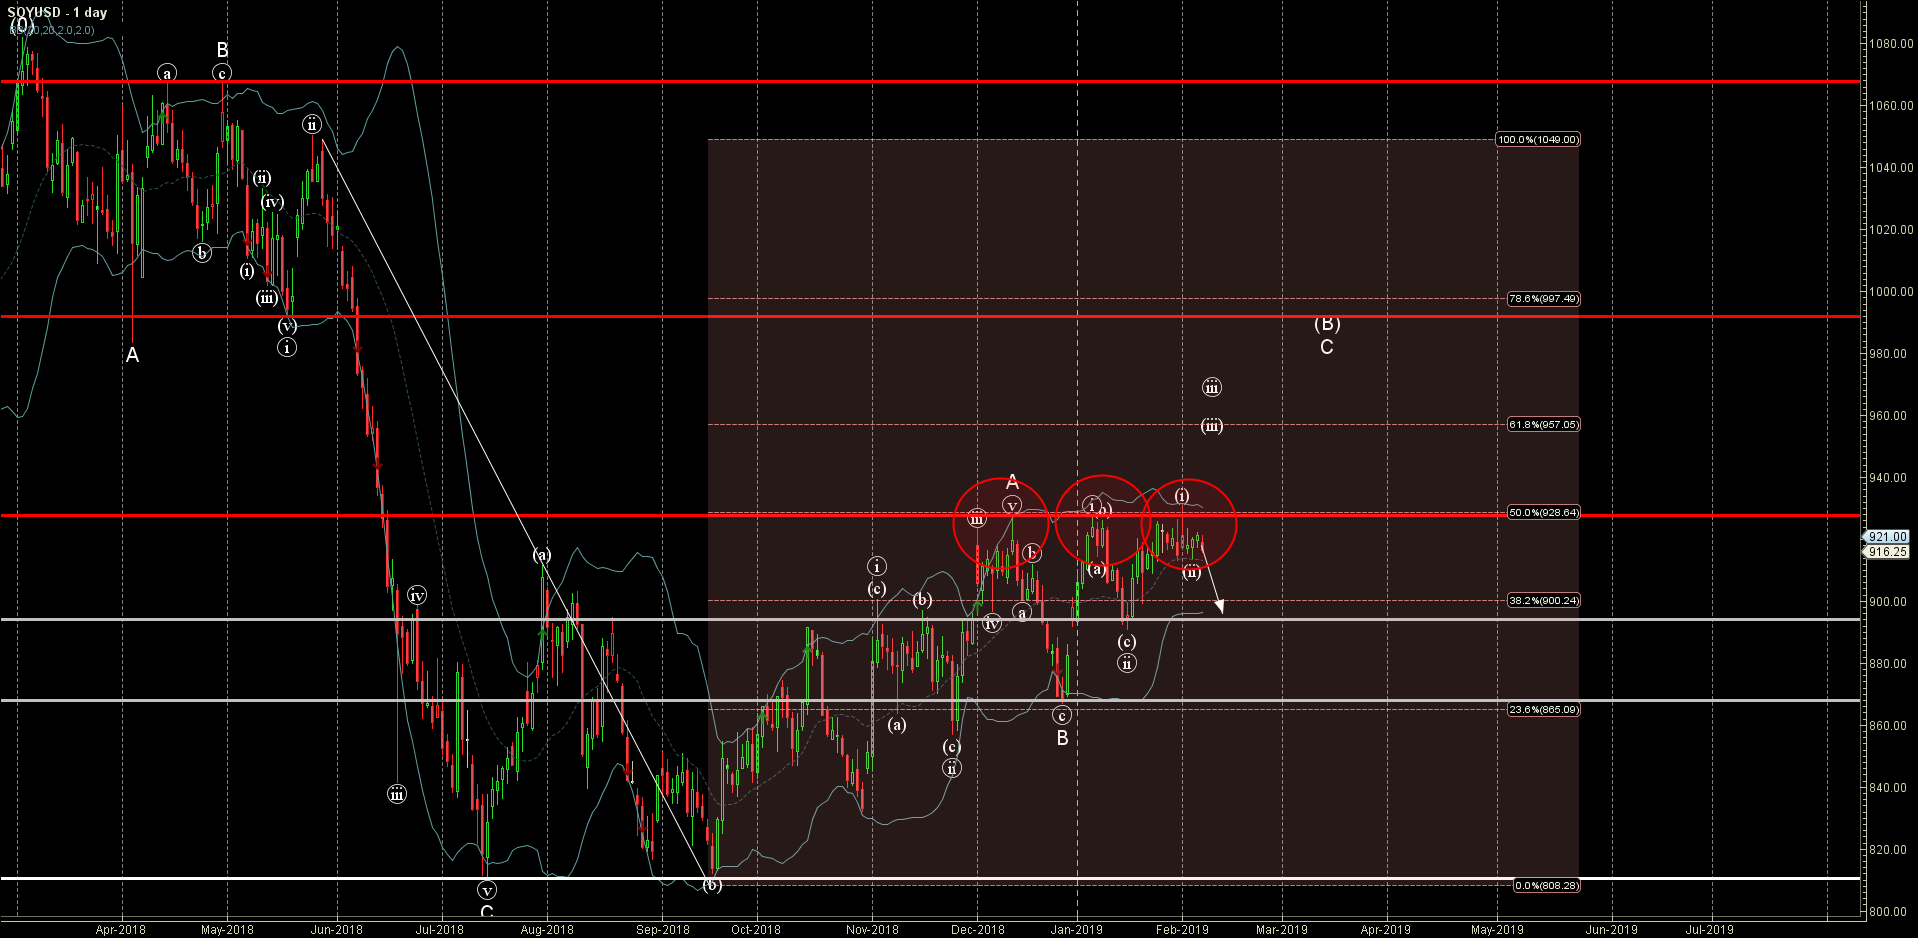
- Soy reversed from resistance area
- Further losses are likely
Soy recently reversed down from the resistance area lying between the key resistance level 927.00 (which has been reversing the price from the end of November), upper daily Bollinger Band and the 50% Fibonacci correction of the sharp downward impulse from May.
The downward reversal from this resistance area created the daily Japanese candlesticks reversal pattern Falling Star.
Soy is expected to fall further and re-test the next support level 895.00 (low of the previous correction (ii)).
Related Articles

EURGBP Wave Analysis 24 April 2024
April 24, 2024 @ 21:42 +03:00

EURJPY Wave Analysis 24 April 2024
April 24, 2024 @ 21:40 +03:00

WTI crude oil Wave Analysis 23 April 2024
April 23, 2024 @ 22:47 +03:00

USDCAD Wave Analysis 23 April 2024
April 23, 2024 @ 22:46 +03:00