

Technical analysis
NZDUSD Wave Analysis – 07 November , 2018
November 07, 2018 @ 16:44 +03:00
- NZDUSD broke resistance zone
- Further gains are likely
NZDUSD continues to rise after the earlier breakout of the resistance zone located between the key resistance level 0.6700 (top of wave 4 from September) and the 61.8% Fibonacci correction of the previous downward impulse from July.
The breakout of this resistance zone accelerated the active impulse wave (C). This price zone is acting as a strong support zone after it was broken.
NZDUSD is like to rise further and re-test the next resistance level 0.6840 (which reversed the price multiple times in July).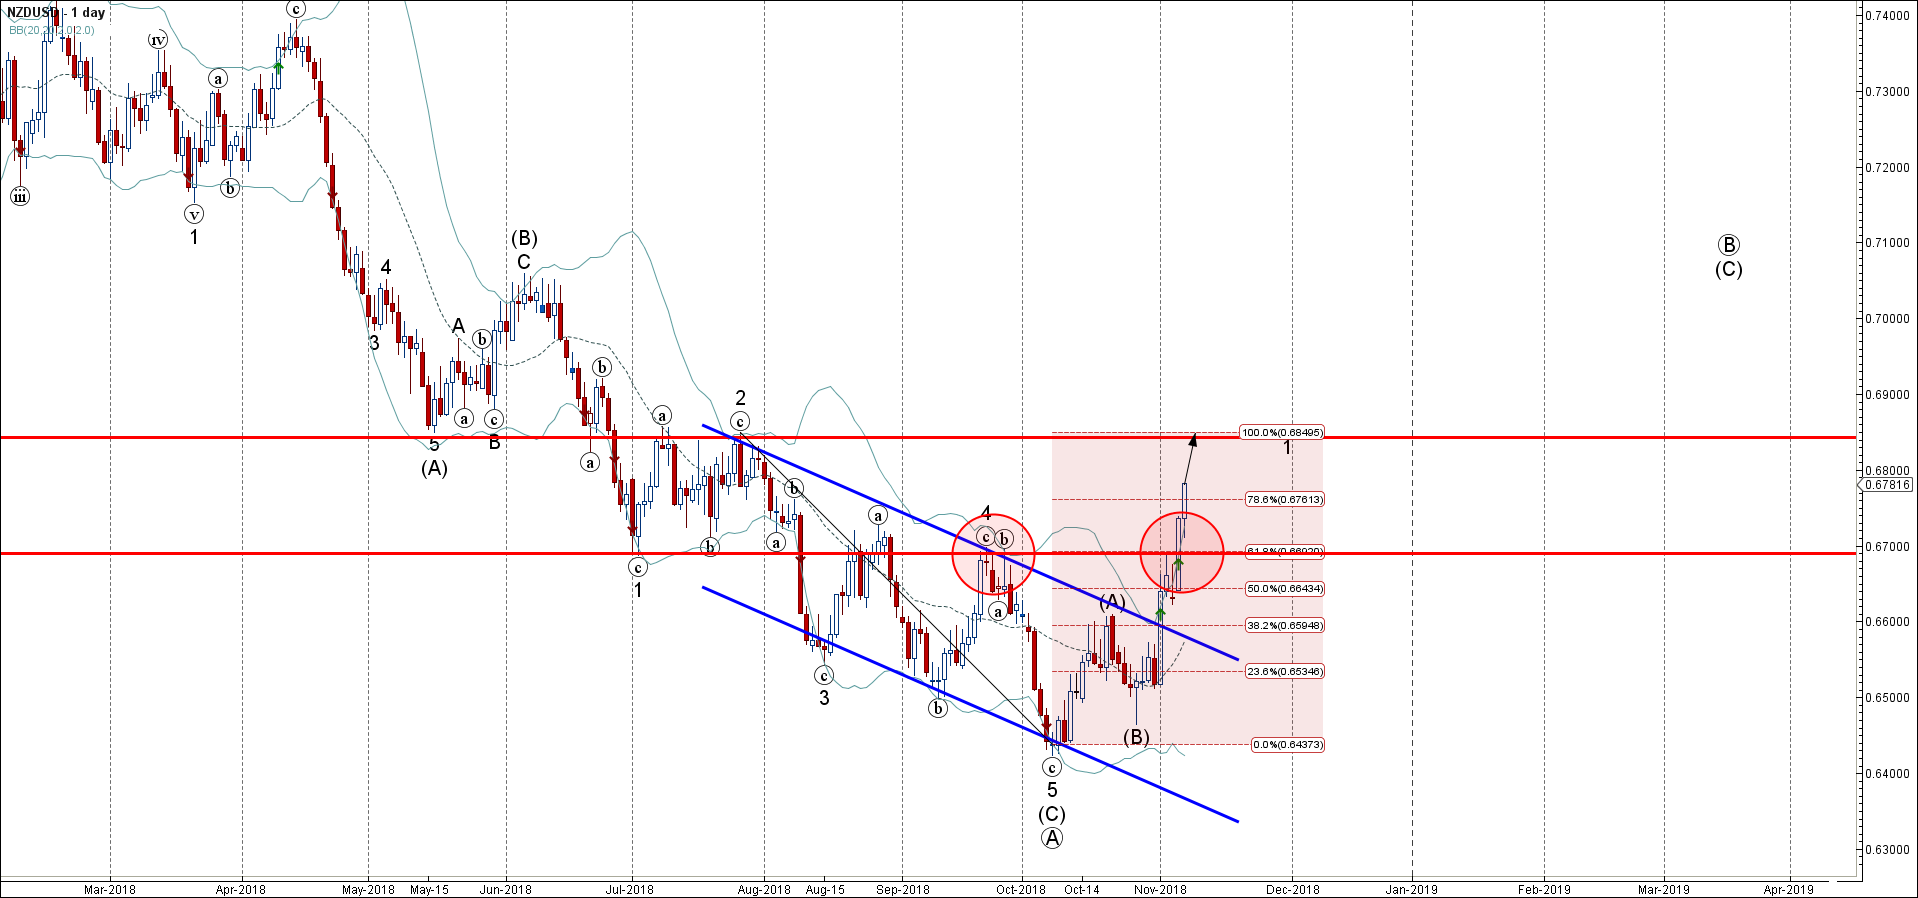
Related Articles

EURGBP Wave Analysis 24 April 2024
April 24, 2024 @ 21:42 +03:00

EURJPY Wave Analysis 24 April 2024
April 24, 2024 @ 21:40 +03:00

WTI crude oil Wave Analysis 23 April 2024
April 23, 2024 @ 22:47 +03:00

USDCAD Wave Analysis 23 April 2024
April 23, 2024 @ 22:46 +03:00