

Technical analysis
NZDUSD Wave Analysis – 06 February, 2019
February 06, 2019 @ 18:33 +03:00
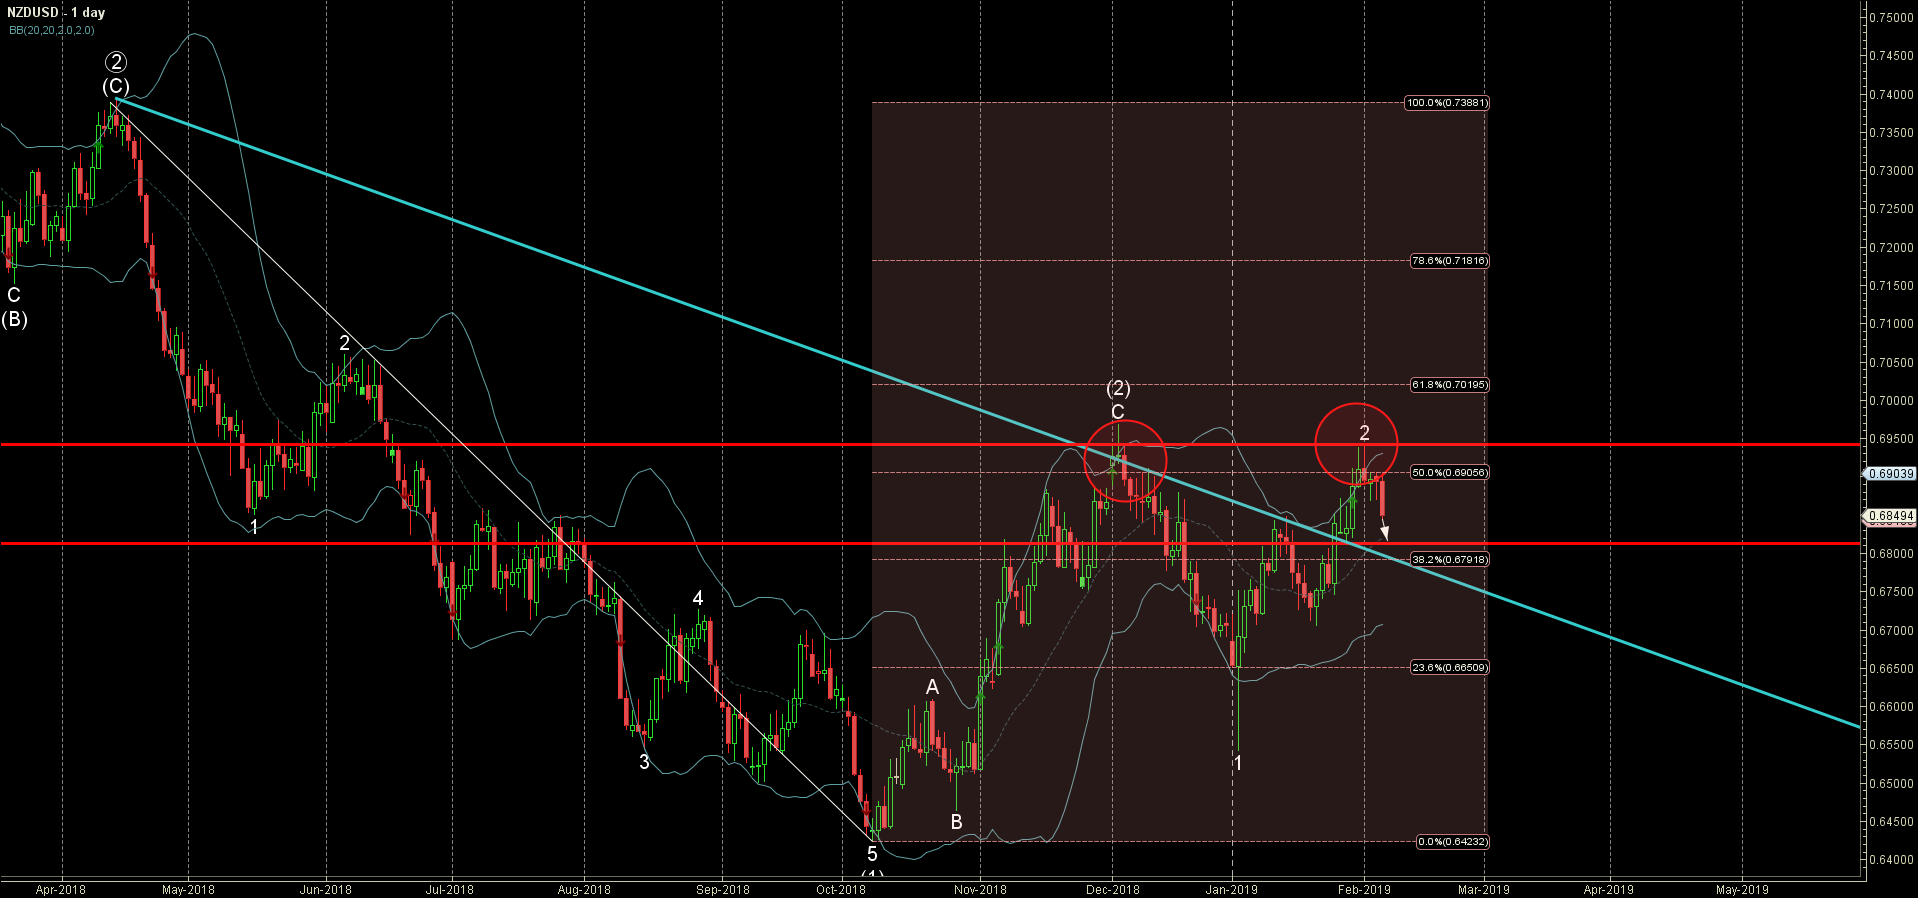
- NZDUSD reversed from resistance area
- Further losses are likely
NZDUSD recently reversed down from the resistance area lying between the pivotal resistance level 0.6940 (which reversed wave (2) in January), upper daily Bollinger Band and the 50% Fibonacci correction of the extended downward impulse (1) from last April.
The downward reversal from this resistance area created the daily Japanese candlesticks reversal pattern Falling Star.
NZDUSD is expected to fall further and re-test the next support level 0.6800 – intersecting with the former resistance trendline from last year (acting as support after it was broken).
Related Articles

Citigroup Wave Analysis 16 April 2024
April 16, 2024 @ 22:06 +03:00

USDJPY Wave Analysis 16 April 2024
April 16, 2024 @ 22:05 +03:00

S&P 500 Wave Analysis 15 April 2024
April 16, 2024 @ 00:44 +03:00

EURUSD Wave Analysis 15 April 2024
April 16, 2024 @ 00:44 +03:00