

Technical analysis
NZDCHF Wave Analysis – 3 October, 2019
October 03, 2019 @ 16:55 +03:00

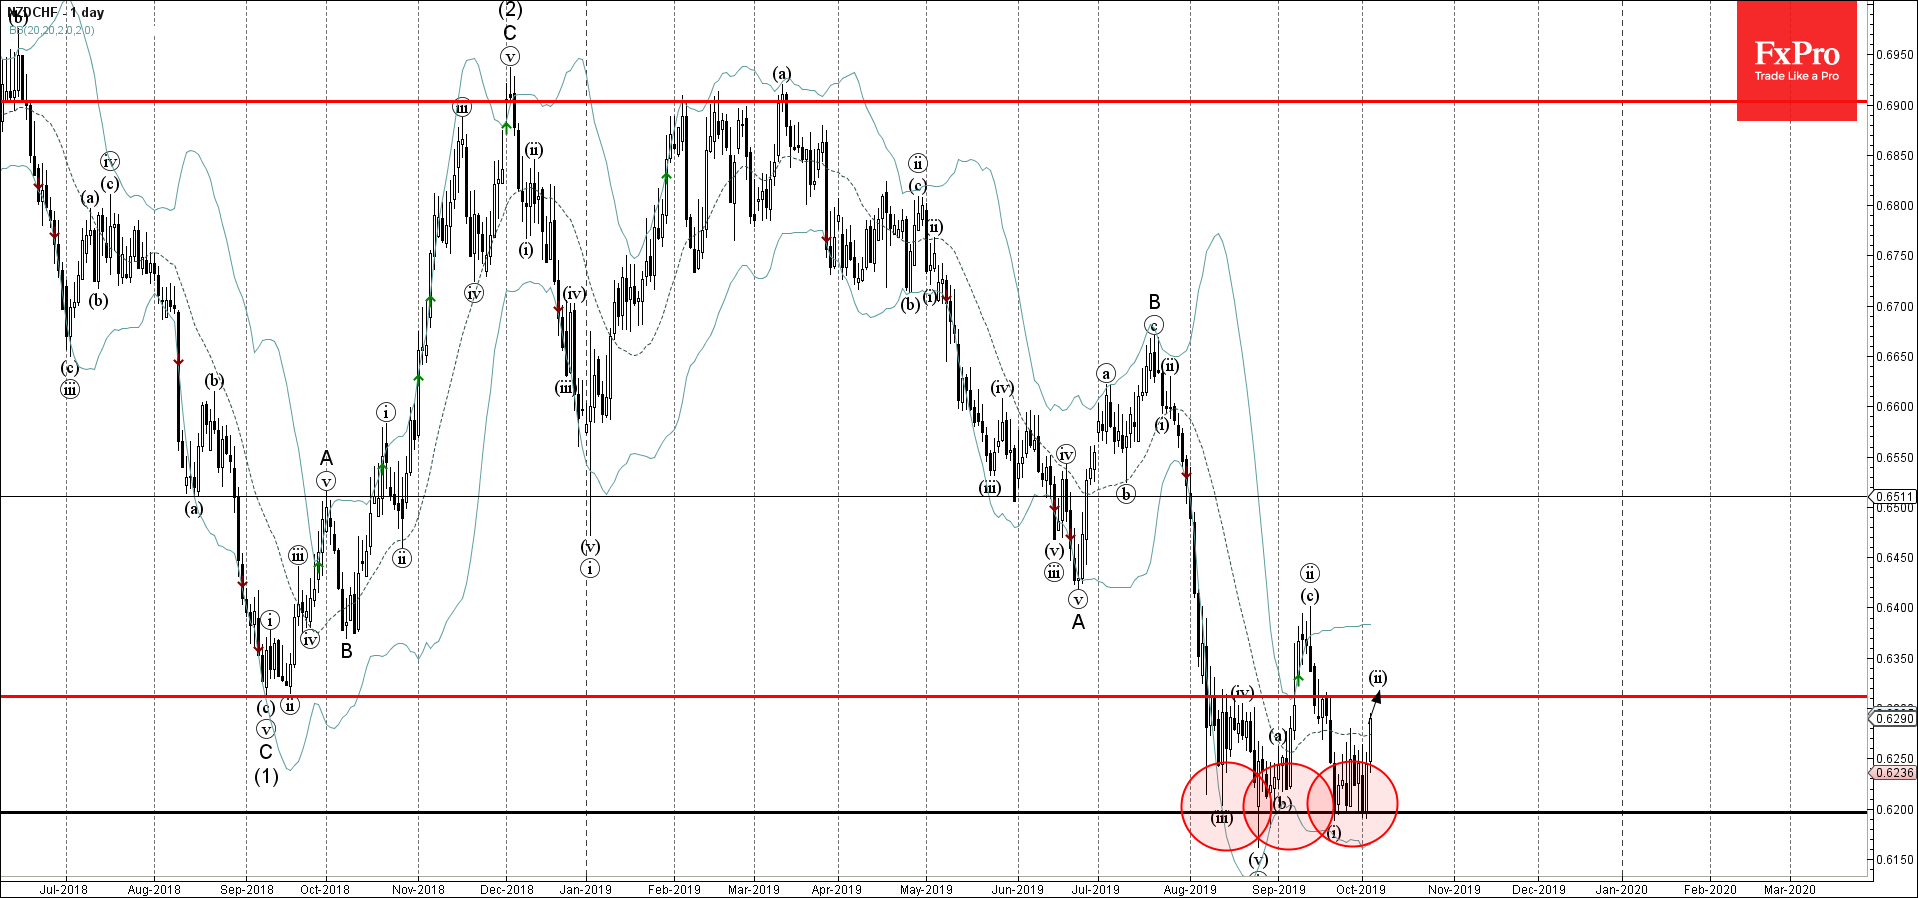
- NZDCHF reversed from the support area
- Likely to rise to 0.6310
NZDCHF recently reversed up with the daily Bullish Engulfing from the support area lying between the support level 0.6200 (which has been reversing the price from August) and the lower daily Bollinger Band.
The upward reversal from this support area started the active short-term ABC correction (ii).
NZDCHF is expected to rise further and retest the next resistance level 0.6310 (target price for the completion of the active correction (ii)).
Related Articles

Citigroup Wave Analysis 16 April 2024
April 16, 2024 @ 22:06 +03:00

USDJPY Wave Analysis 16 April 2024
April 16, 2024 @ 22:05 +03:00

S&P 500 Wave Analysis 15 April 2024
April 16, 2024 @ 00:44 +03:00

EURUSD Wave Analysis 15 April 2024
April 16, 2024 @ 00:44 +03:00