

Technical analysis
NZDCHF Wave Analysis – 20 September, 2019
September 20, 2019 @ 16:58 +03:00

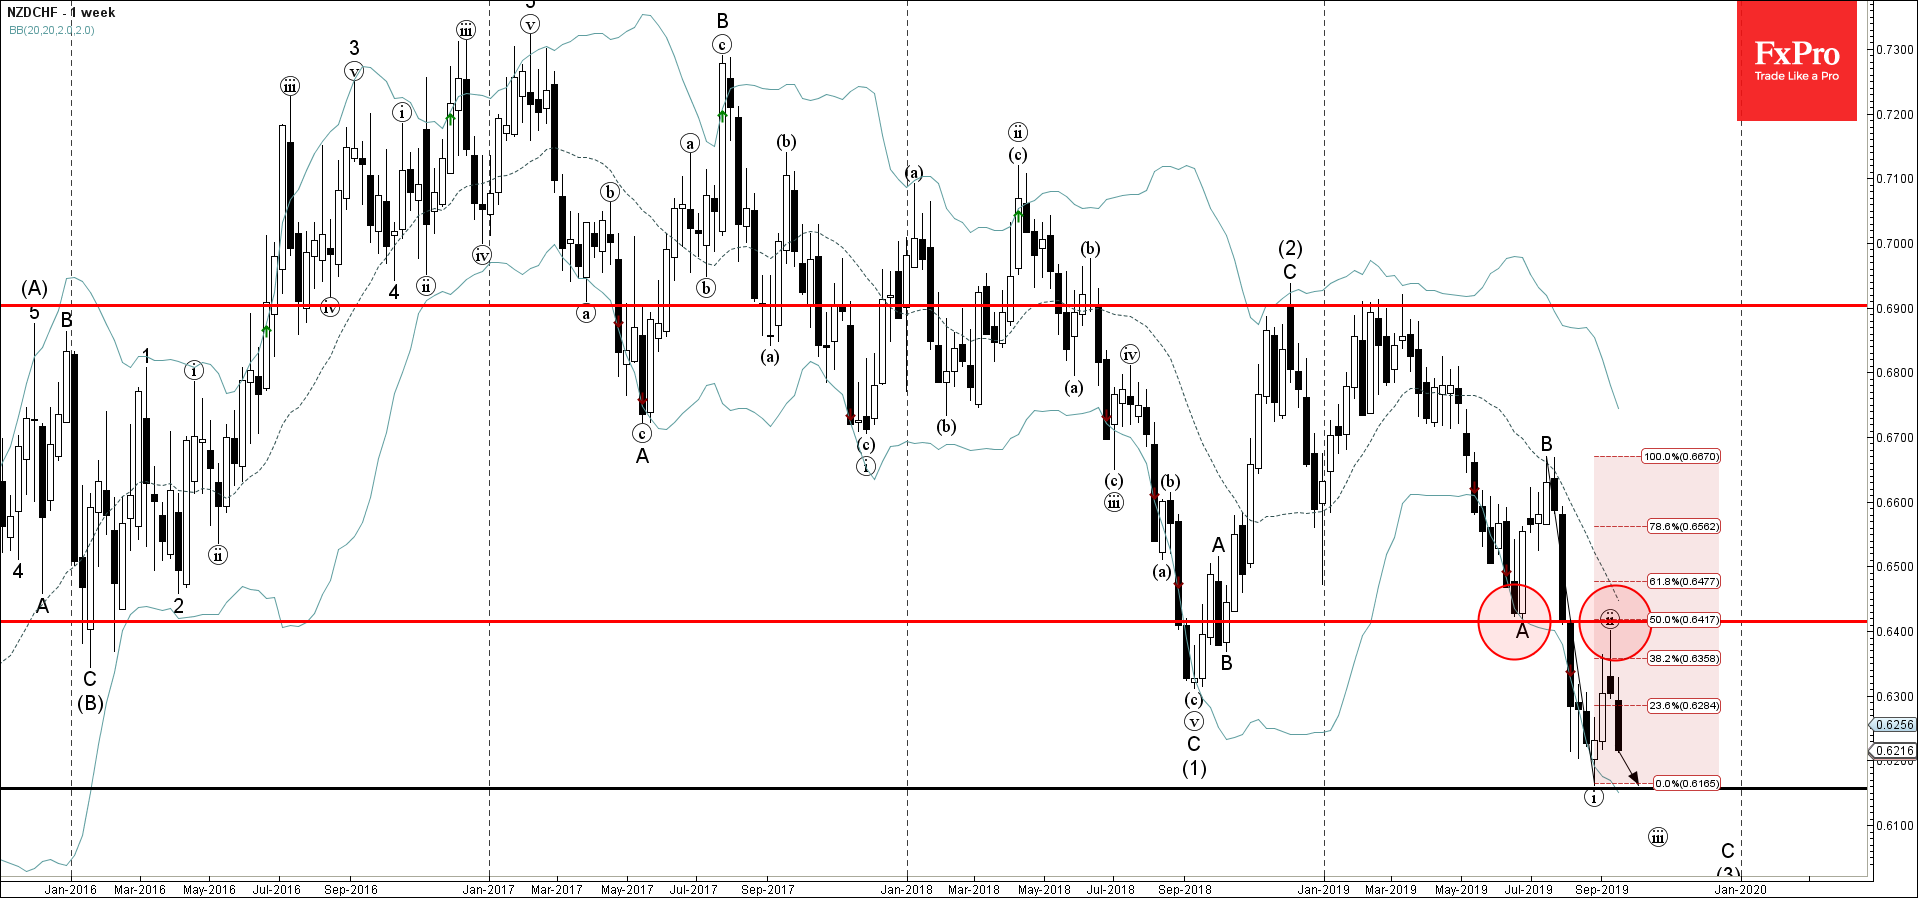
- NZDCHF falling inside impulse wave (iii)
- Further losses likely toward 0.6160
NZDCHF continues to fall inside the short-term impulse wave (iii) which started earlier from the resistance area located between the resistance level 0.6400 (former support from June) and the 50% Fibonacci correction of the weekly impulse (i) from July.
The downward reversal from the aforementioned resistance area created the weekly reversal pattern Shooting Star.
NZDCHF is expected to fall further and retest the next support level 0.6160 (low of the previous impulse wave (i) from August).
Related Articles

EURGBP Wave Analysis 24 April 2024
April 24, 2024 @ 21:42 +03:00

EURJPY Wave Analysis 24 April 2024
April 24, 2024 @ 21:40 +03:00

WTI crude oil Wave Analysis 23 April 2024
April 23, 2024 @ 22:47 +03:00

USDCAD Wave Analysis 23 April 2024
April 23, 2024 @ 22:46 +03:00