

Technical analysis
NZDCHF Wave Analysis – 14 May, 2019
May 14, 2019 @ 18:17 +03:00

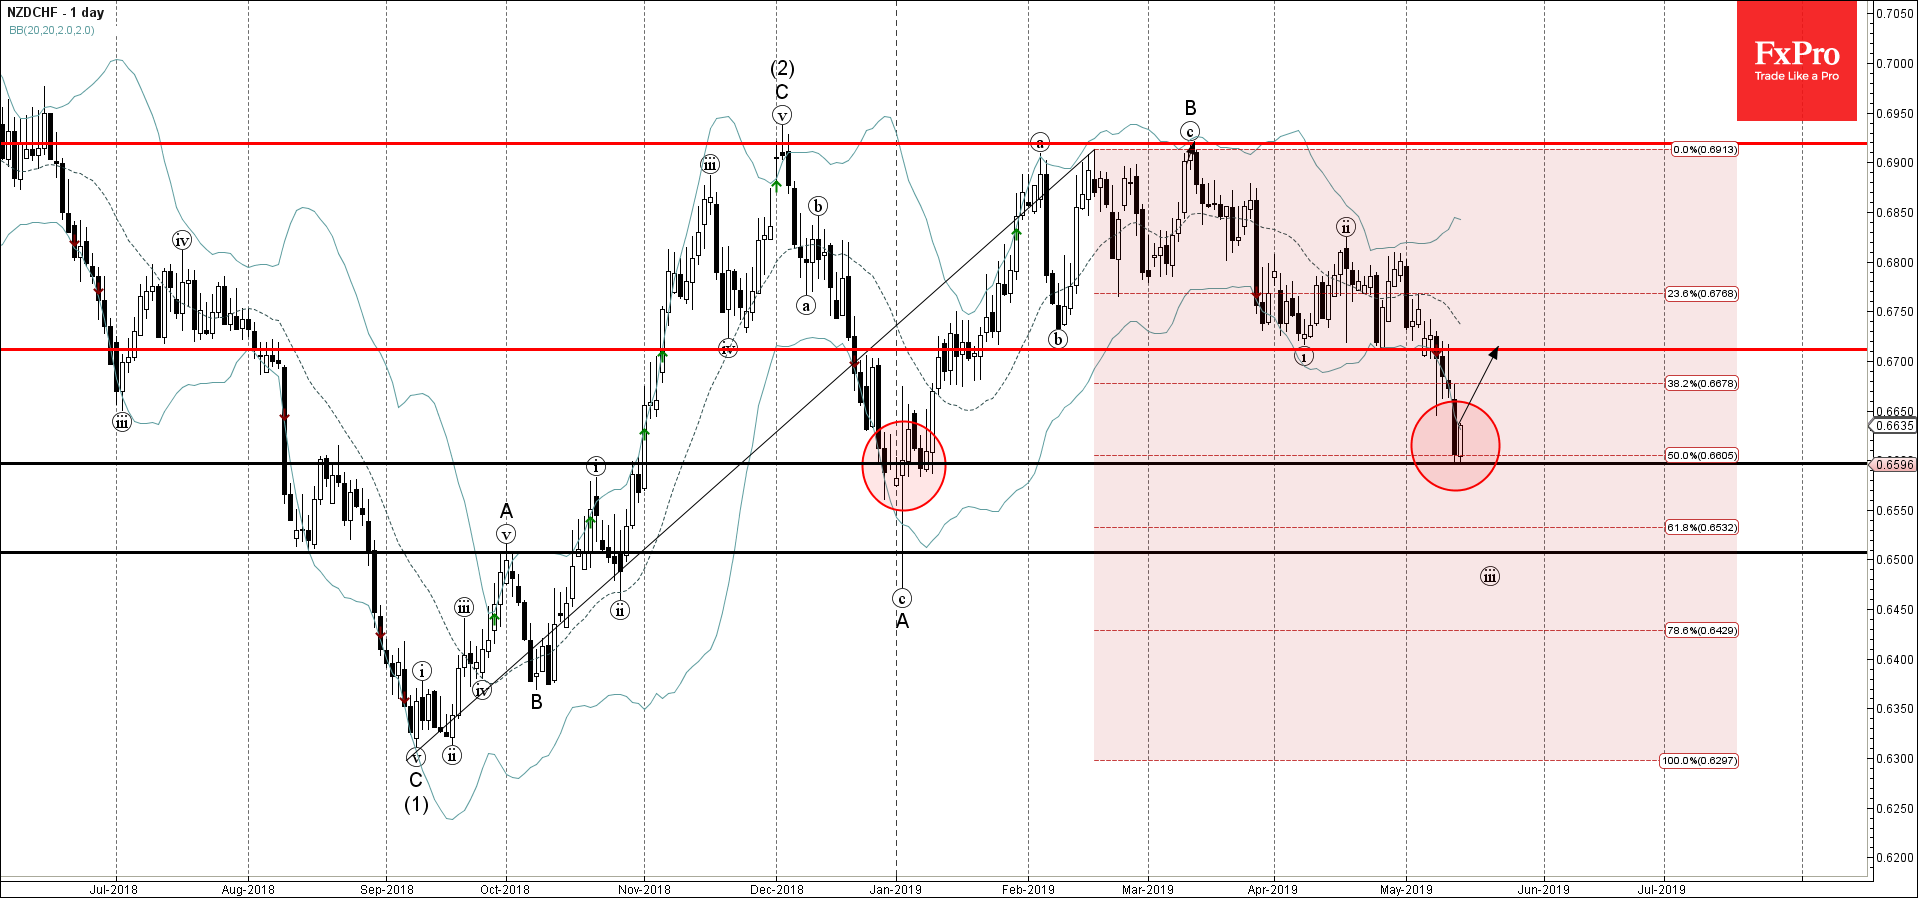
- NZDCHF reversed from support area
- Further gains are likely
NZDCHF recently reversed up from the support area lying between the support level 0.6600 (which stopped the previous downward correction in January), lower daily Bollinger Band and the 50% Fibonacci correction of the upward impulse from September.
The upward reversal from this support area stopped the previous short-term impulse wave (iii) from the middle of April.
NZDCHF is expected to rise further and retest the next resistance level 0.6710 (former strong support from April).
Related Articles

EURJPY Wave Analysis 18 April 2024
April 18, 2024 @ 23:09 +03:00

EURUSD Wave Analysis 18 April 2024
April 18, 2024 @ 23:08 +03:00

WTI Wave Analysis 17 April 2024
April 17, 2024 @ 22:40 +03:00

EURGBP Wave Analysis 17 April 2024
April 17, 2024 @ 22:38 +03:00