

NZDCHF Wave Analysis – 11 March, 2019
March 11, 2019 @ 18:57 +03:00

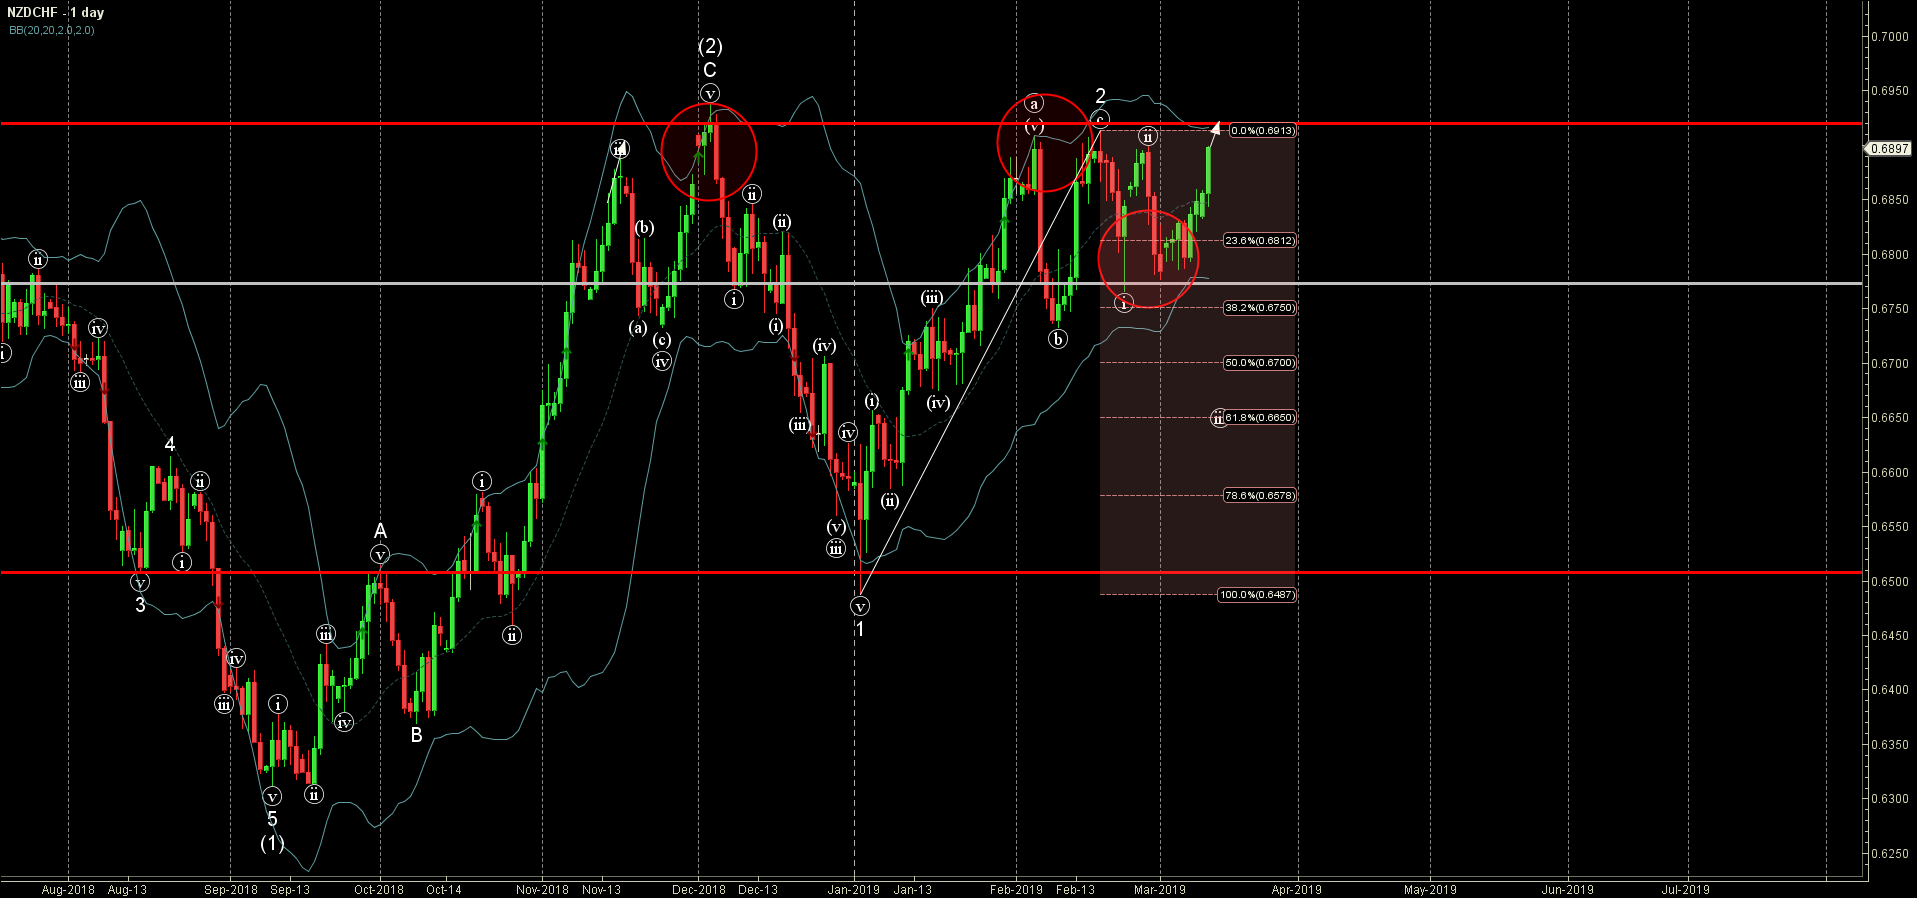
• NZDCHF reversed from support area • Further gains are likely
NZDCHF continues to rise after the recent upward reversal from the support area lying between the support level 0.6770 (which reversed the price with the daily Hammer at the end of last month), lower daily Bollinger Band and the 38.2% Fibonacci correction of the previous upward impulse from January.
The upward reversal from this support area stopped the previous impulse wave (iii).
NZDCHF is expected to rise further and re-test the next key resistance support level 0.6919 (which has been there reversing the price from the start of December).

April 23, 2024 @ 22:47 +03:00

April 23, 2024 @ 22:46 +03:00

April 19, 2024 @ 22:12 +03:00

April 19, 2024 @ 22:11 +03:00