

Technical analysis
NZDCAD Wave Analysis – 7 June, 2019
June 07, 2019 @ 15:50 +03:00

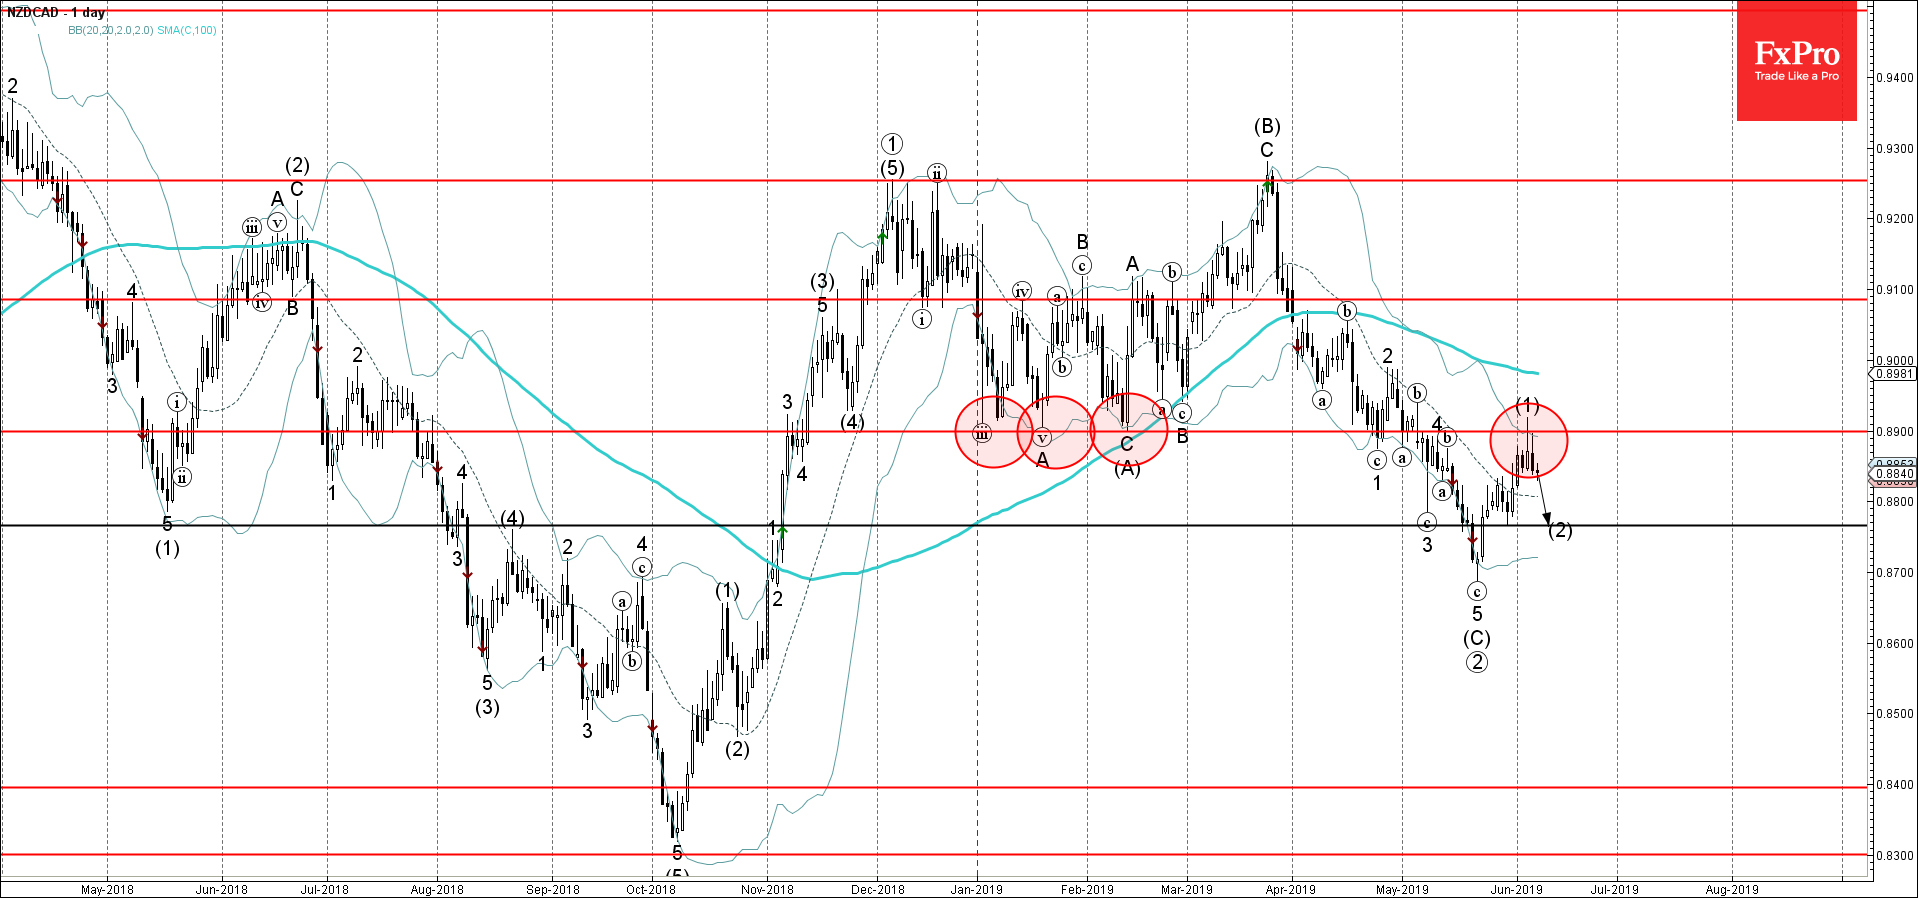
- NZDCAD reversed from resistance zone
- Further losses are likely
NZDCAD recently reversed down from the resistance zone lying between the key resistance level 0.9800 (former strong support from January and February) and the upper daily Bollinger Band.
The downward reversal from this resistance zone created the daily Japanese candlesticks reversal pattern Shooting Star.
NZDCAD is expected to fall further and retest the next round support level 0.8770 (former support pivot from the end of May and the target for completion of wave (2)).
Related Articles

Intel Wave Analysis 19 April 2024
April 19, 2024 @ 22:12 +03:00

GBPUSD Wave Analysis 19 April 2024
April 19, 2024 @ 22:11 +03:00

EURJPY Wave Analysis 18 April 2024
April 18, 2024 @ 23:09 +03:00

EURUSD Wave Analysis 18 April 2024
April 18, 2024 @ 23:08 +03:00