

Technical analysis
Natural Gas Wave Analysis – 29 October, 2019
October 29, 2019 @ 11:44 +03:00

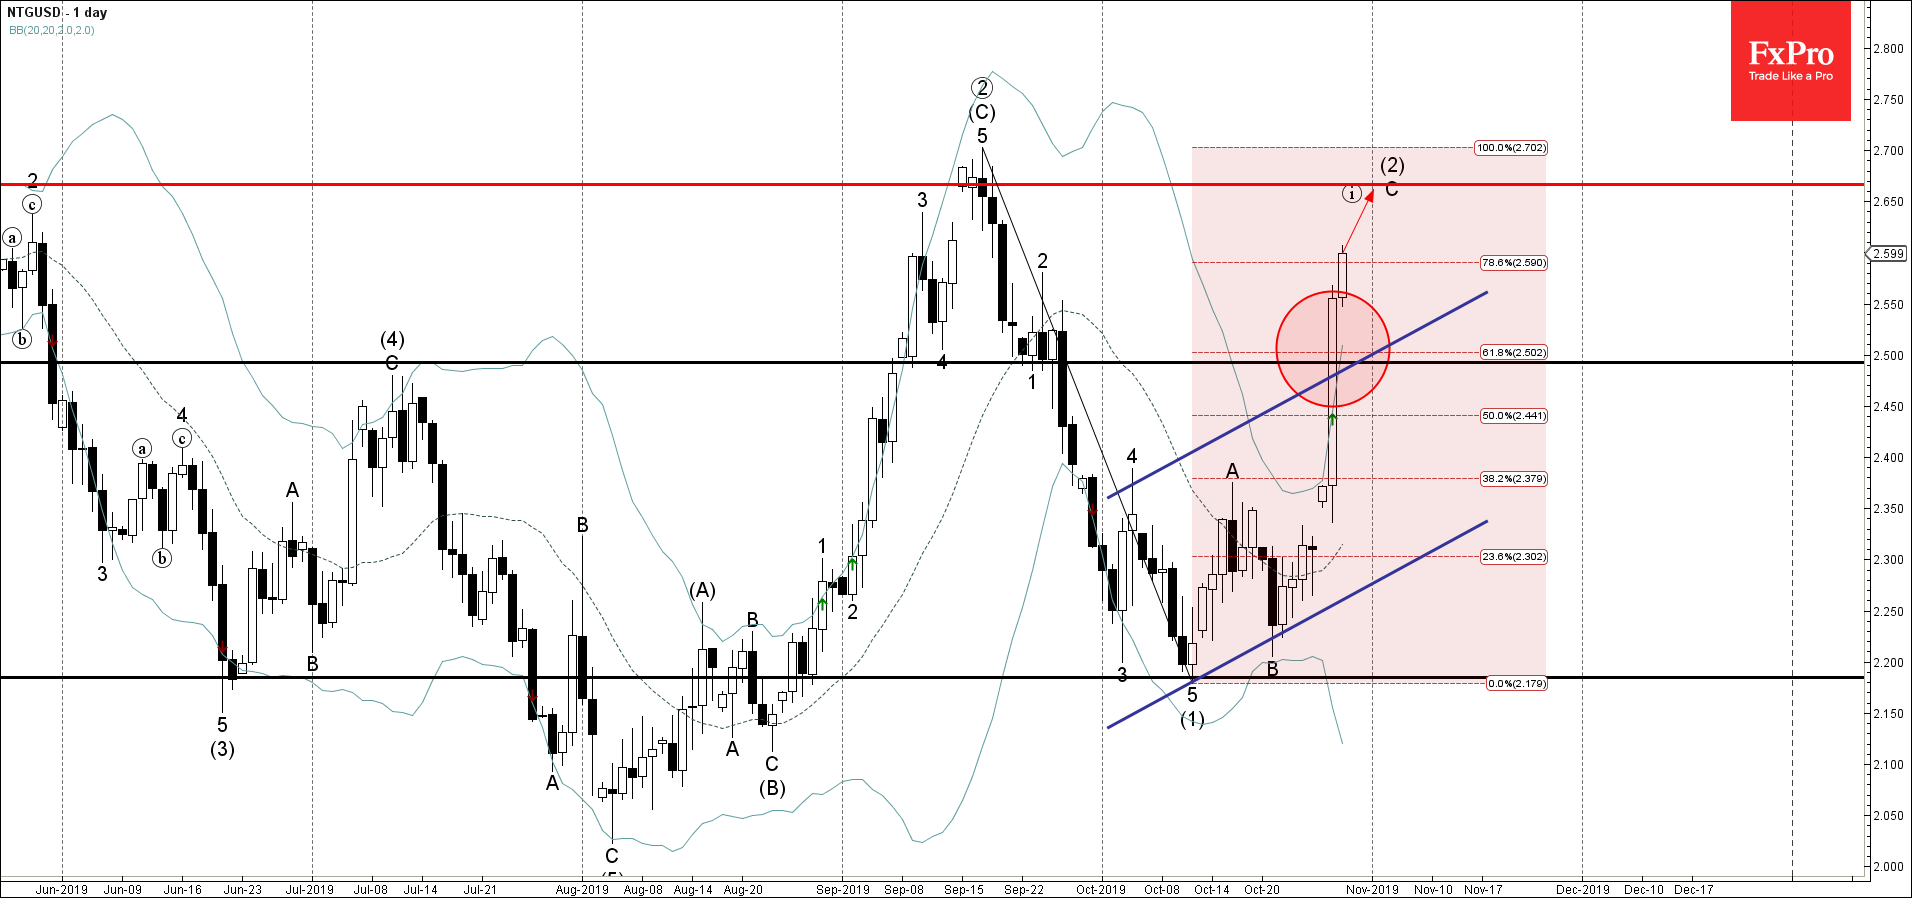
- Natural Gas broke resistance area
- Likely to rise to 2.700
Natural Gas recently broke resistance area lying between the resistance level 2.500, resistance trendline of the daily up channel from the start of October and the 61.8% Fibonacci correction of the previous impulse wave (1).
The breakout of this resistance area strengthened the bullish pressure on Natural Gas.
Natural Gas is expected to rise further and retest the next resistance level 2.700 (monthly high from May and September and the forecast price for the completion of wave (2)).
Related Articles

WTI crude oil Wave Analysis 23 April 2024
April 23, 2024 @ 22:47 +03:00

USDCAD Wave Analysis 23 April 2024
April 23, 2024 @ 22:46 +03:00

Intel Wave Analysis 19 April 2024
April 19, 2024 @ 22:12 +03:00

GBPUSD Wave Analysis 19 April 2024
April 19, 2024 @ 22:11 +03:00