

Technical analysis
Natural gas Wave Analysis 22 February, 2021
February 22, 2021 @ 19:16 +03:00

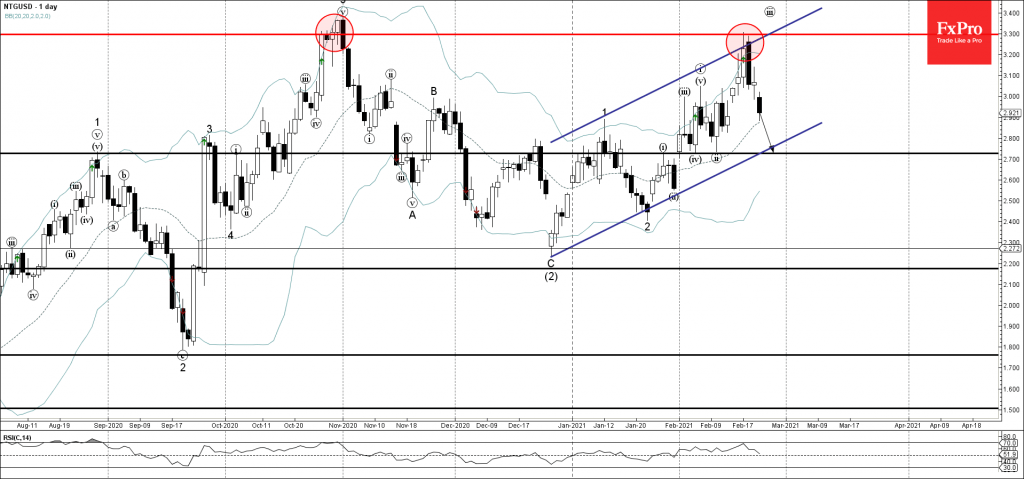
• Natural gas reversed from resistance level 3.300
• Likely to reach support level 2.700
Natural gas under bearish pressure after the price failed to hold the ground above the key resistance level 3.300 (which stopped the previous sharp uptrend in October).
The downward reversal from the resistance level 3.300 created the daily candlestick reversal pattern Bearish Engulfing.
Natural gas can be expected to fall further toward the next support level 2.7000 (low of the previous minor corrections (iv) and (ii)).
Related Articles

EURJPY Wave Analysis 18 April 2024
April 18, 2024 @ 23:09 +03:00

EURUSD Wave Analysis 18 April 2024
April 18, 2024 @ 23:08 +03:00

WTI Wave Analysis 17 April 2024
April 17, 2024 @ 22:40 +03:00

EURGBP Wave Analysis 17 April 2024
April 17, 2024 @ 22:38 +03:00