

Technical analysis
Natural gas Wave Analysis – 15 November, 2019
November 15, 2019 @ 16:37 +03:00

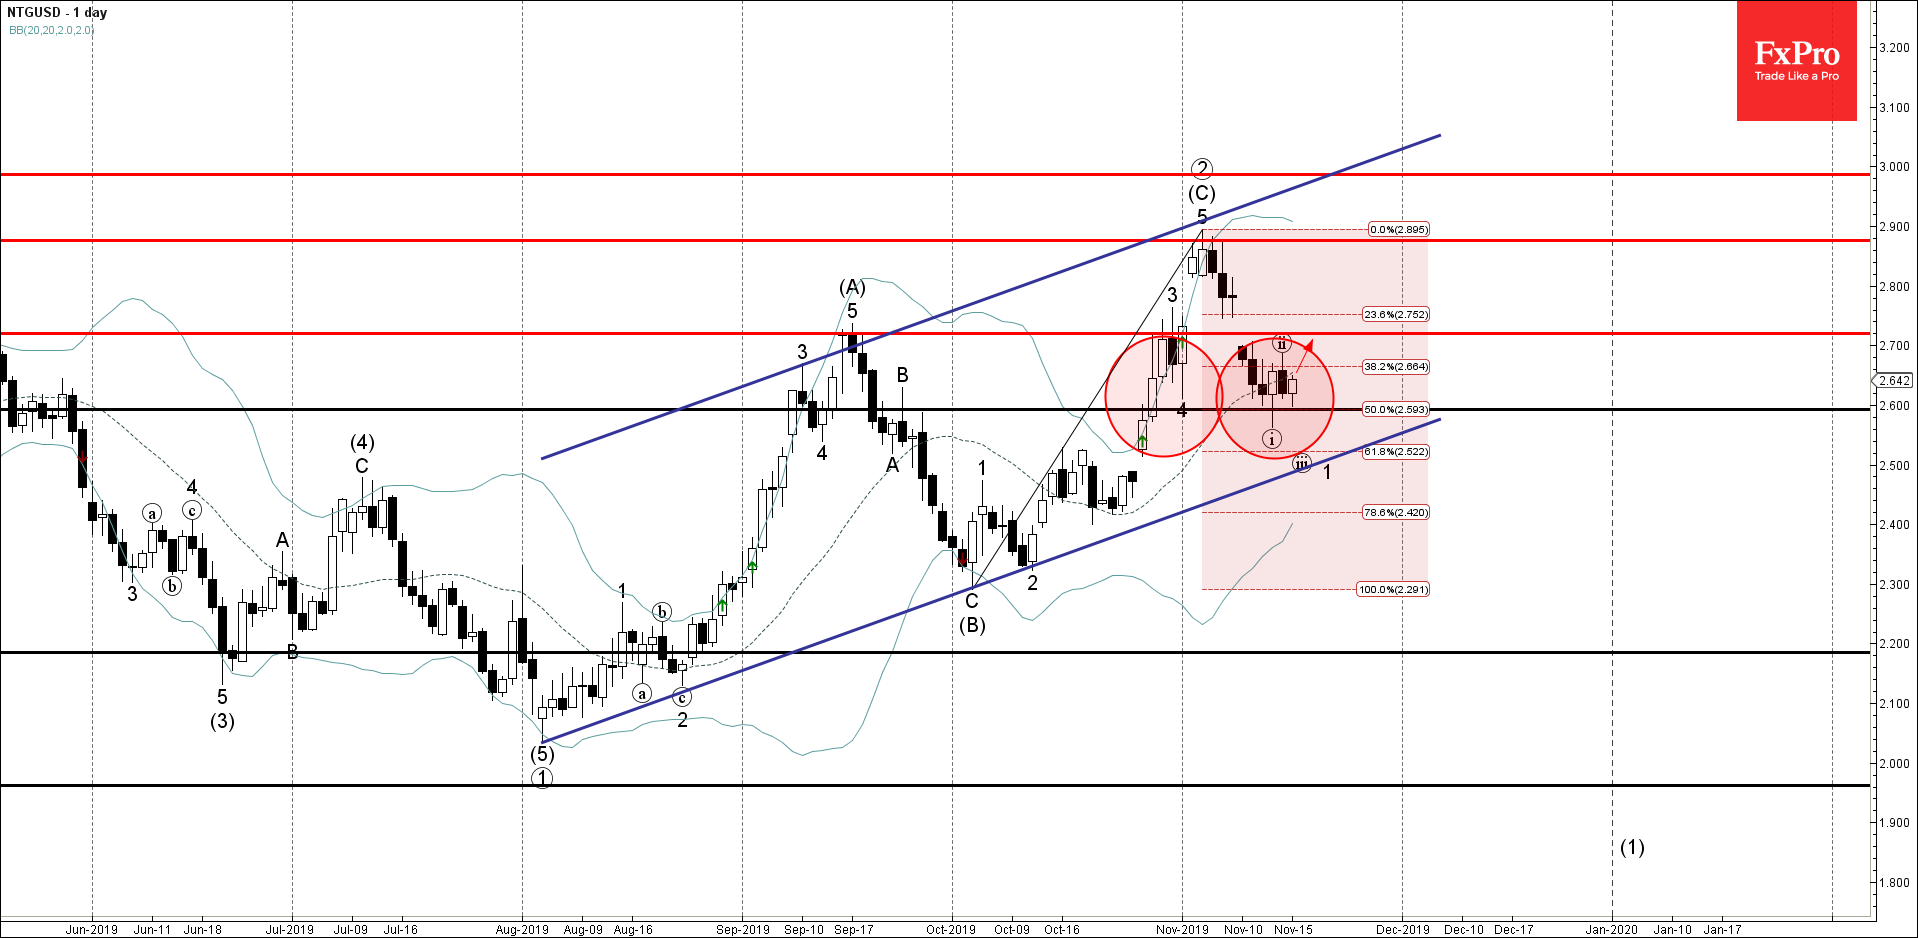
- Natural gas reversed from support area
- Likely to rise to 2.700
Natural gas recently reversed up from the support area lying between the support level 2.600, lower daily Bollinger Band and the 50% Fibonacci correction of the previous upward impulse (C) from the start of October.
The upward reversal from this support area stopped the earlier short-term impulse wave 1.
Natural gas is expected to rise further toward the next resistance level 2.700 (which reversed earlier wave (ii))
Related Articles

Intel Wave Analysis 19 April 2024
April 19, 2024 @ 22:12 +03:00

GBPUSD Wave Analysis 19 April 2024
April 19, 2024 @ 22:11 +03:00

EURJPY Wave Analysis 18 April 2024
April 18, 2024 @ 23:09 +03:00

EURUSD Wave Analysis 18 April 2024
April 18, 2024 @ 23:08 +03:00