

Technical analysis
Natural Gas Wave Analysis – 15 April, 2019
April 15, 2019 @ 18:55 +03:00

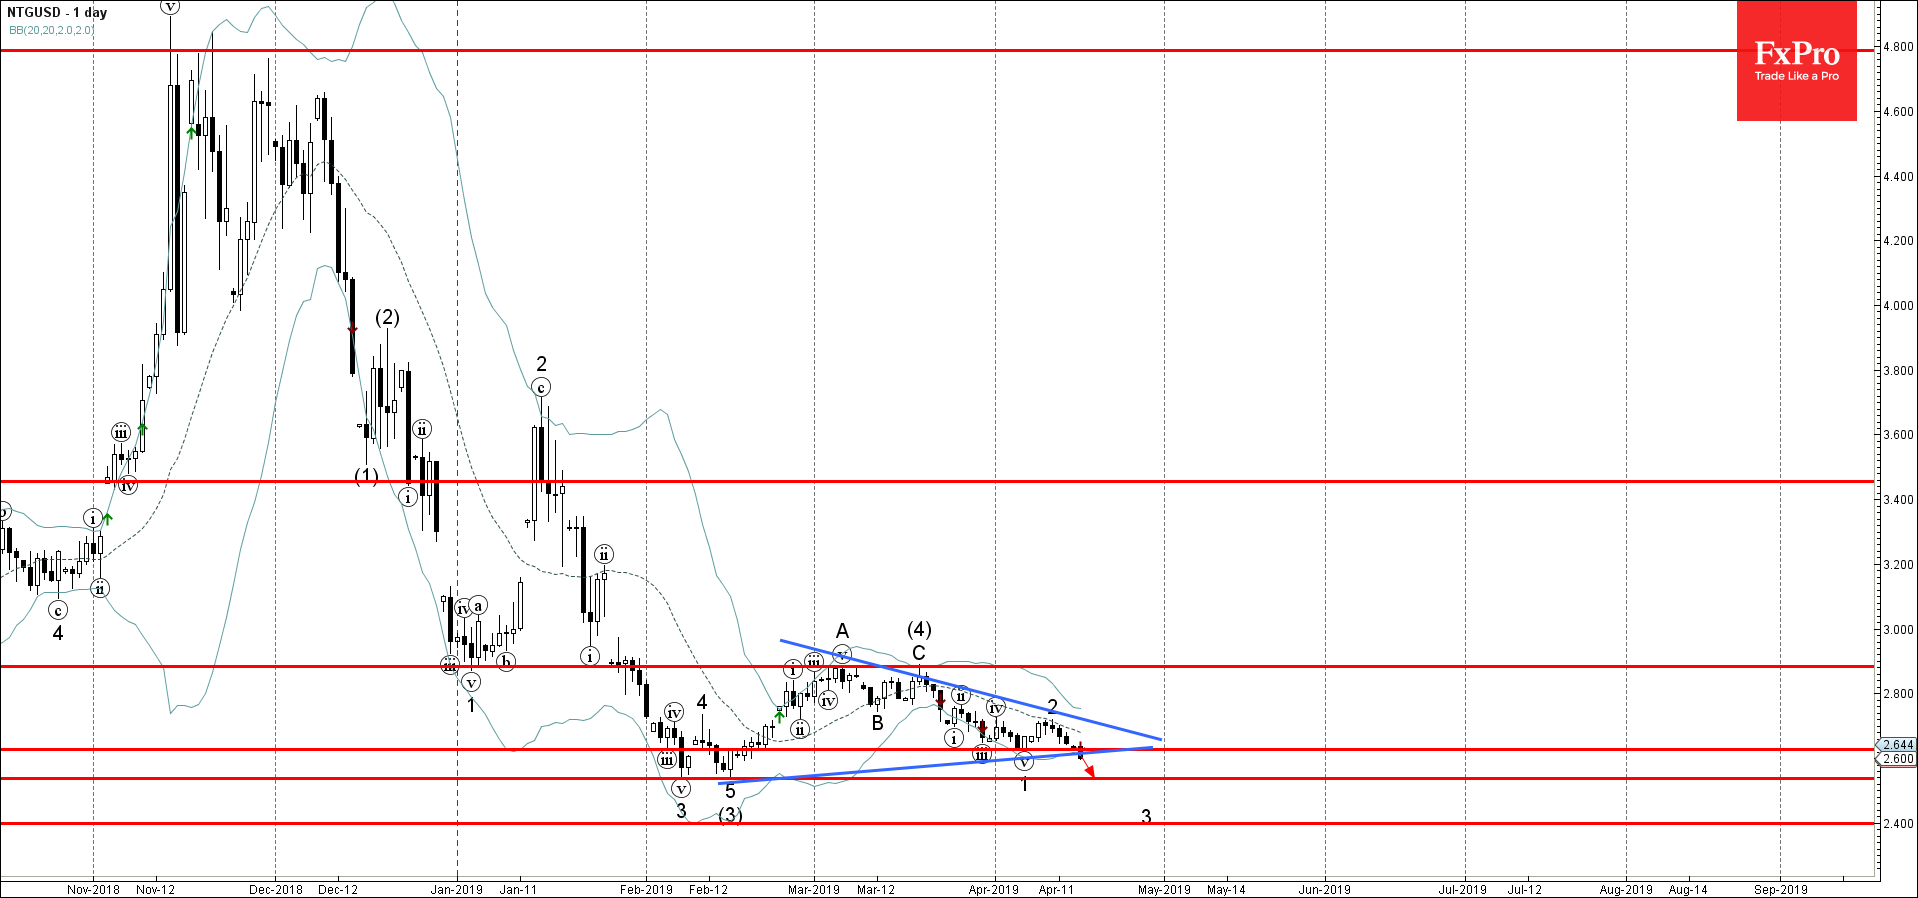
- Natural Gas broke key support level 2.625
- Further losses are likely
Natural Gas recently broke below the key support level 2.625 (which previously stopped the impulse 1 of the active downward medium-term impulse sequence (5) form March).
The breakout of the support level 2.625 coincided with breakout of the support trendline of the daily Triangle from February – which should accelerate the active impulse wave 3.
Natural Gas is expected to fall further and re-test the next support level 2.540 (low of the previous waves 3 and (3) from February).
Related Articles

Intel Wave Analysis 19 April 2024
April 19, 2024 @ 22:12 +03:00

GBPUSD Wave Analysis 19 April 2024
April 19, 2024 @ 22:11 +03:00

EURJPY Wave Analysis 18 April 2024
April 18, 2024 @ 23:09 +03:00

EURUSD Wave Analysis 18 April 2024
April 18, 2024 @ 23:08 +03:00