

Natural Gas Wave Analysis – 13 December , 2018
December 13, 2018 @ 17:53 +03:00

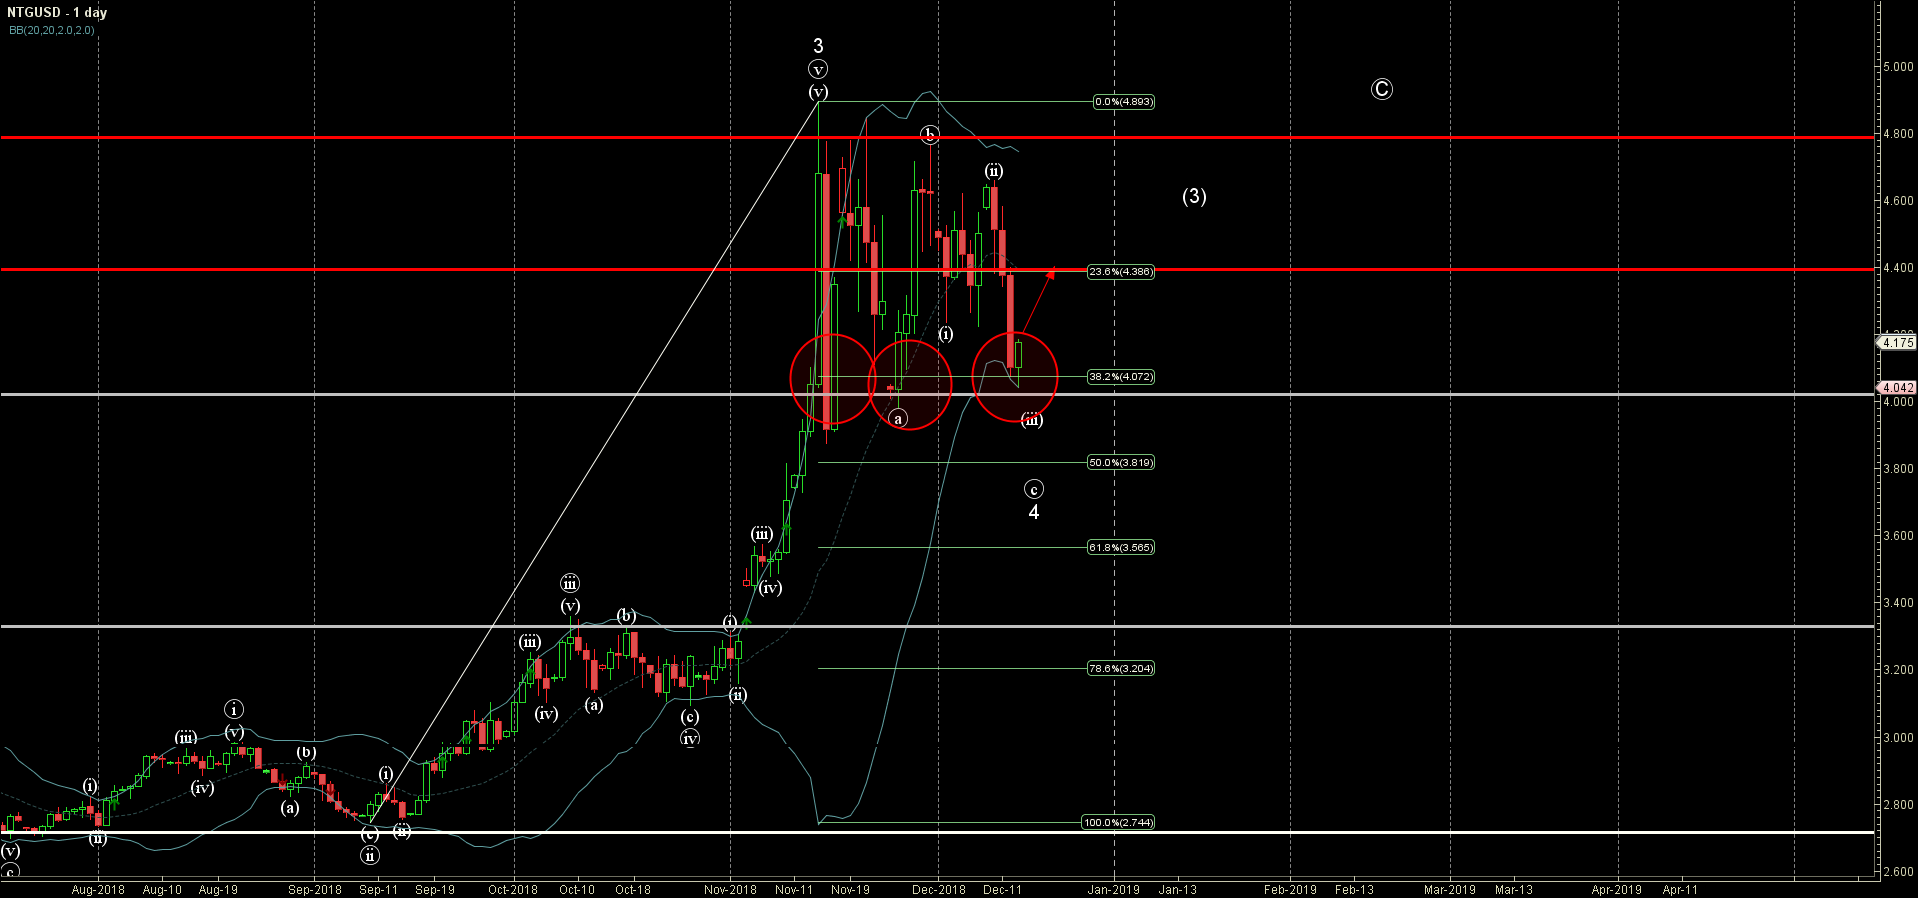
- Natural Gas reversed from support area
- Further gains are likely
Natural Gas continues to rise after the earlier upward reversal from the support area lying between the round support level 4.000 (which has been reversing the price from the middle of November), 38.2% Fibonacci correction of the upward impulse from September and the lower weekly Bollinger Band.
The upward reversal from this support area stopped the previous short-term impulse wave (c) of the ABC correction 4 from the start of November.
Natural Gas is expected to rise further and re-test the next resistance level 4.400 (lying midway between the aforementioned support level 4.000 and 4.800 (strong resistance from November

April 19, 2024 @ 22:12 +03:00

April 19, 2024 @ 22:11 +03:00

April 18, 2024 @ 23:09 +03:00

April 18, 2024 @ 23:08 +03:00