

Technical analysis
Natural gas Wave Analysis – 11 June, 2020
June 11, 2020 @ 17:54 +03:00

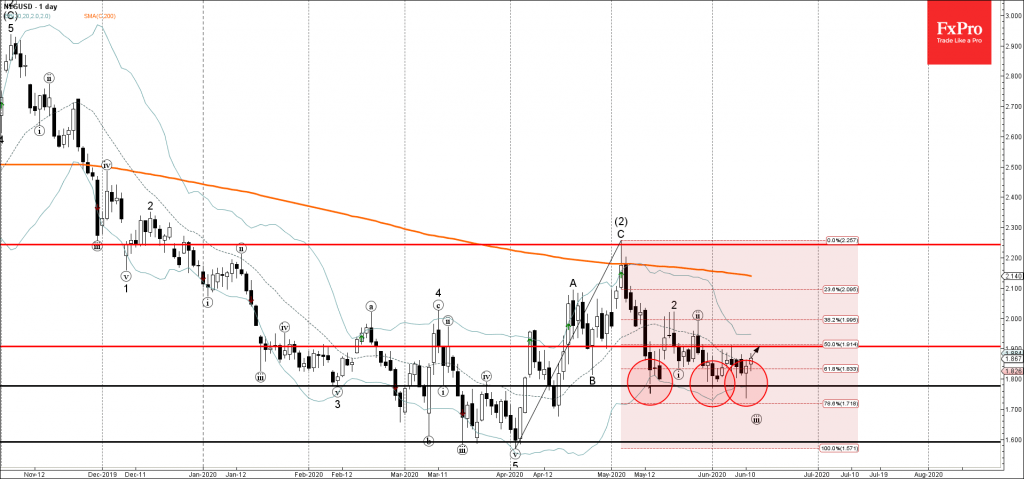
• Natural gas reversed from pivotal support level 1.775
• Likely to rise to 1,900
Natural gas continues to rise after the earlier upward reversal from the pivotal support level 1.775 (former double bottom from May) – standing near the lower daily Bollinger Band.
The upward reversal from the support level 1.775 created the daily Japanese candlesticks reversal pattern Hammer.
Natural gas is likely to rise further toward the next resistance level 1,900 (which reversed the price at the start of June).
Related Articles

EURGBP Wave Analysis 24 April 2024
April 24, 2024 @ 21:42 +03:00

EURJPY Wave Analysis 24 April 2024
April 24, 2024 @ 21:40 +03:00

WTI crude oil Wave Analysis 23 April 2024
April 23, 2024 @ 22:47 +03:00

USDCAD Wave Analysis 23 April 2024
April 23, 2024 @ 22:46 +03:00