

Technical analysis
Natural Gas Wave Analysis – 04 September, 2019
September 04, 2019 @ 16:23 +03:00

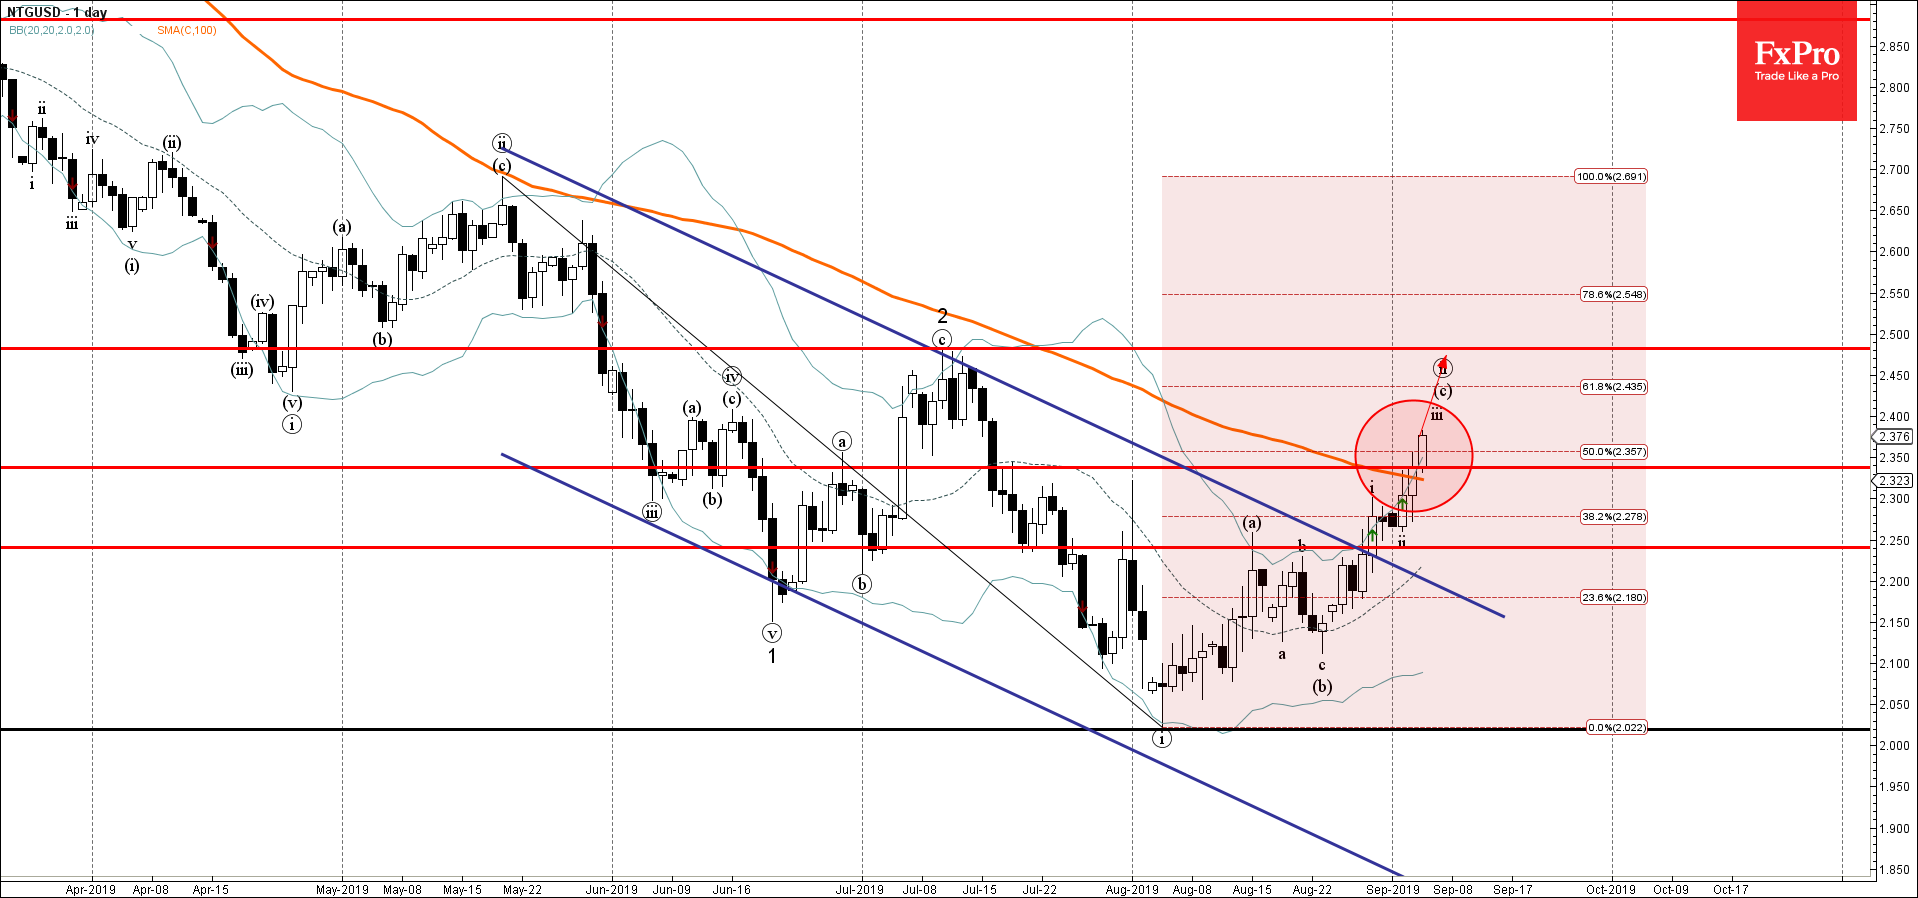
- Natural Gas broke resistance area
- Further gains are likely
Natural Gas recently broke the resistance area lying between the resistance level 2.340, 100-day moving average and the 50% Fibonacci correction of the previous downward impulse from May.
The breakout of this resistance area should accelerate the c-wave of the active ABC correction (ii) from the start of August.
Natural Gas is expected to rise further and retest the next resistance level 2.480 (top of the previous minor correction 2 from July and the target for the completion of the active wave (ii)).
Related Articles

EURJPY Wave Analysis 18 April 2024
April 18, 2024 @ 23:09 +03:00

EURUSD Wave Analysis 18 April 2024
April 18, 2024 @ 23:08 +03:00

WTI Wave Analysis 17 April 2024
April 17, 2024 @ 22:40 +03:00

EURGBP Wave Analysis 17 April 2024
April 17, 2024 @ 22:38 +03:00