

Gold Wave Analysis – 9 June, 2020
June 09, 2020 @ 17:40 +03:00

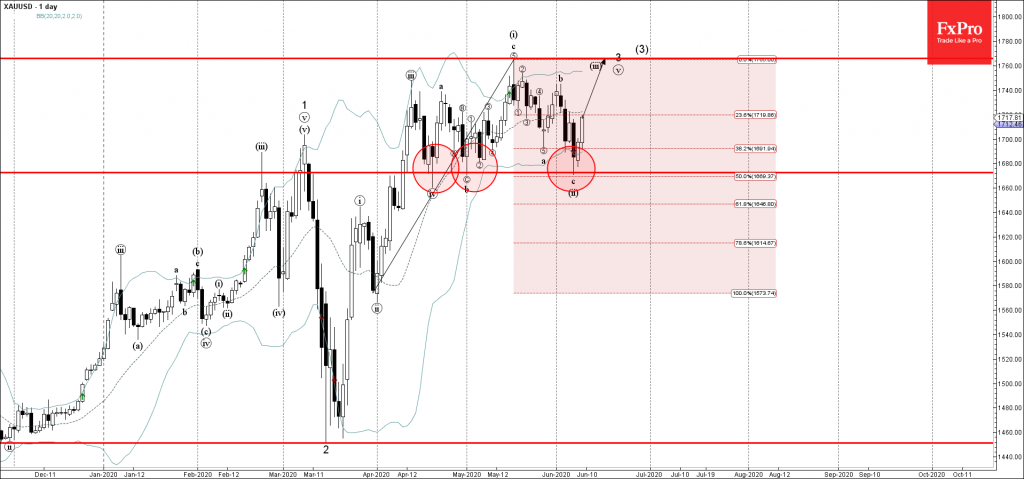
• Gold reversed from support area
• Likely to rise to 1765.00
Gold recently reversed up from the support area lying between pivotal support level 1670.00 (which has been reversing the price from the middle of April), lower daily Bollinger Band and the 50% Fibonacci correction of the previous upward impulse from March.
The upward reversal from this support area started the active short-term impulse wave (v) – which belongs to higher-order nested impulse waves 3 and (3).
Gold is likely to rise further toward the next resistance level 1765.00 (monthly high from May and the target for the completion of the active impulse wave 3).

April 23, 2024 @ 22:47 +03:00

April 23, 2024 @ 22:46 +03:00

April 19, 2024 @ 22:12 +03:00

April 19, 2024 @ 22:11 +03:00