

Technical analysis
Gold Wave Analysis 9 April, 2021
April 09, 2021 @ 18:06 +03:00

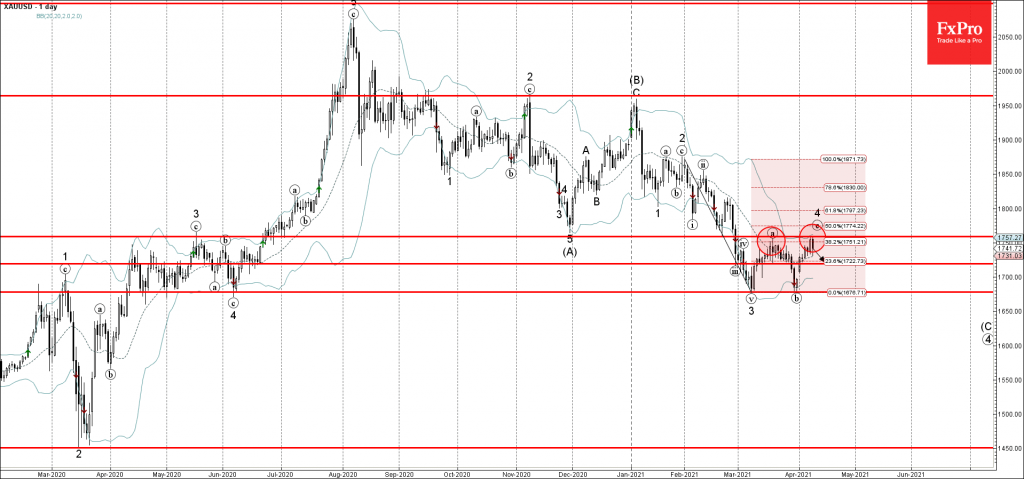
• Gold reversed from key resistance level 1757.00
• Likely to fall to support level 1720.00
Gold recently reversed down from the key resistance level 1757.00 (top of the previous wave (a)), intersecting with the upper daily Bollinger Band and 38.2% Fibonacci correction of the downward impulse from February.
The downward reversal from the resistance level 1757.00 stopped the previous short-term impulse wave (c).
Gold is likely to fall further in the active impulse wave (C) toward the next support level 1720.00.
Related Articles

EURGBP Wave Analysis 24 April 2024
April 24, 2024 @ 21:42 +03:00

EURJPY Wave Analysis 24 April 2024
April 24, 2024 @ 21:40 +03:00

WTI crude oil Wave Analysis 23 April 2024
April 23, 2024 @ 22:47 +03:00

USDCAD Wave Analysis 23 April 2024
April 23, 2024 @ 22:46 +03:00