

Technical analysis
Gold Wave Analysis – 20 June, 2019
June 20, 2019 @ 17:35 +03:00

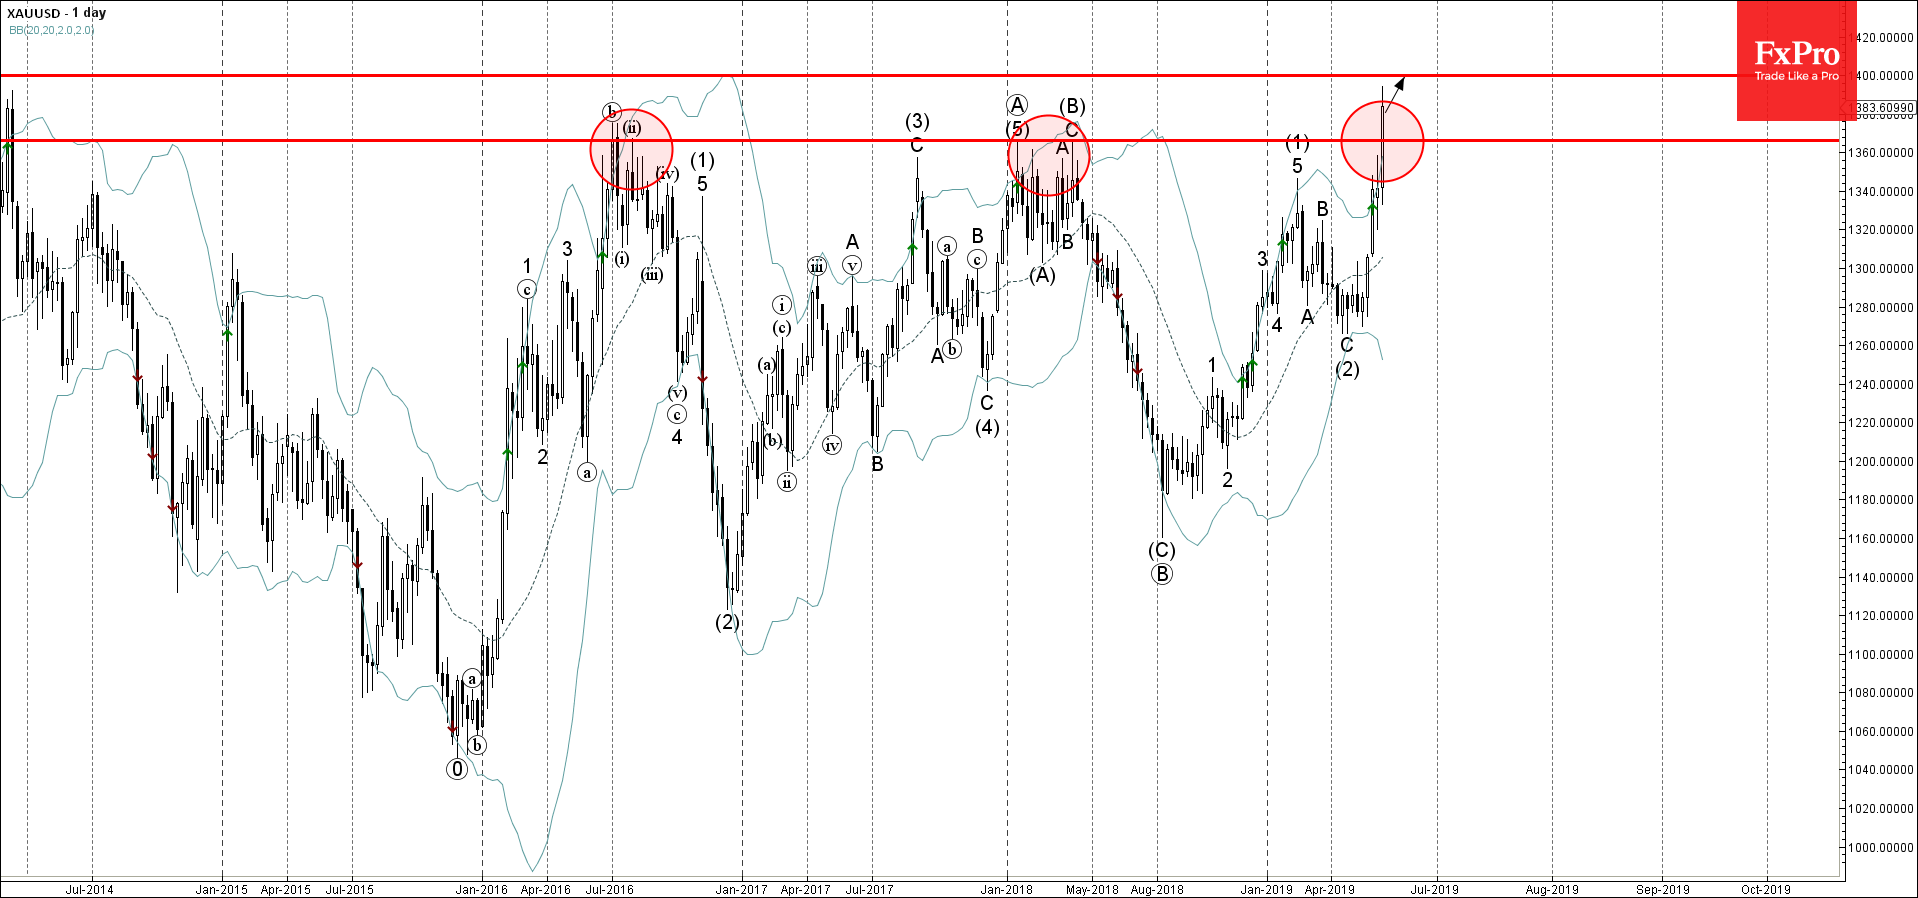
- Gold broke long-term resistance level 1370.00
- Further gains are likely
Gold recently broke the key long-term resistance level 1370.00 (which has been reversing the price from July of 2016, as can be seen from the weekly Gold chart below).
The breakout of the resistance level 1370.00 strengthened the bullish pressure on this instrument – accelerating the active impulse wave (3).
Gold is expected to rise further and retest the next resistance level 1400.00.
Related Articles

EURJPY Wave Analysis 18 April 2024
April 18, 2024 @ 23:09 +03:00

EURUSD Wave Analysis 18 April 2024
April 18, 2024 @ 23:08 +03:00

WTI Wave Analysis 17 April 2024
April 17, 2024 @ 22:40 +03:00

EURGBP Wave Analysis 17 April 2024
April 17, 2024 @ 22:38 +03:00