

Technical analysis
Gold Wave Analysis – 18 March, 2019
March 18, 2019 @ 16:52 +03:00

- Gold reversed from support area
- Further gains are likely
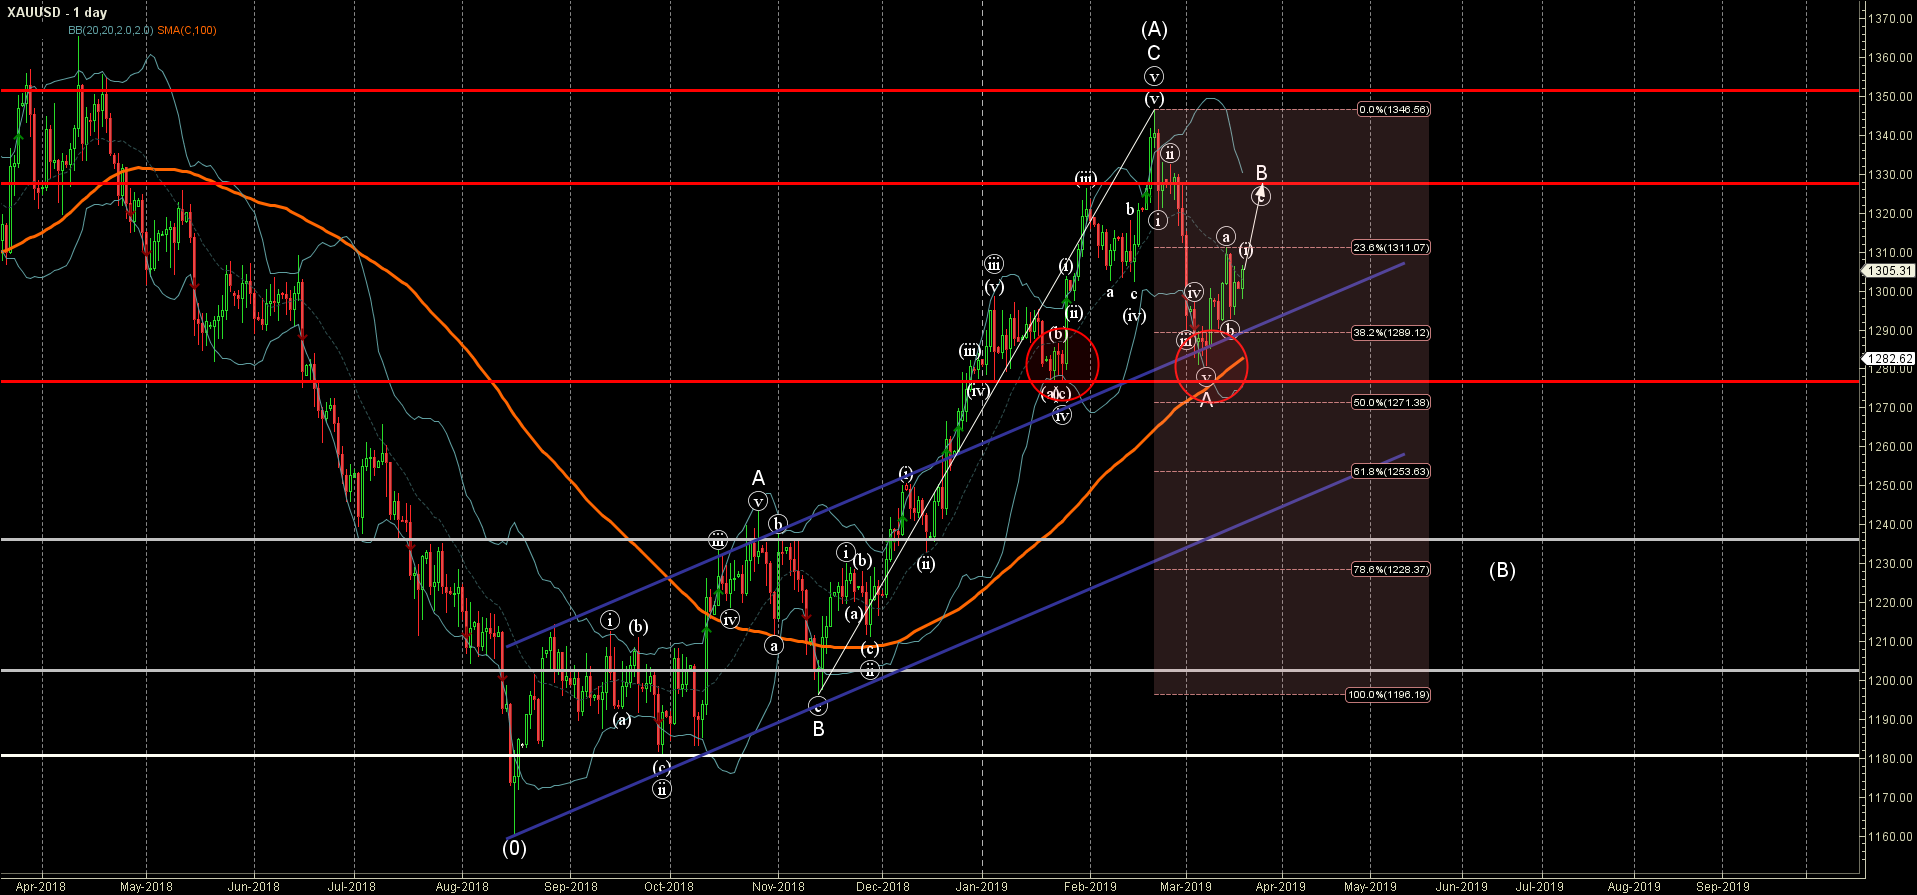
Gold recently reversed up from the support area lying between the strong support level 1280.00 (monthly low from January), 100-day moving average and the lower daily Bollinger Band.
The upward reversal from this support area started the active short-term wave B – which belongs to ABC correction (C) from February.
Gold is expected to rise further in the active wave B and re-test the next resistance level 1330.00 (target price for the completion of the active wave B).
Related Articles

Intel Wave Analysis 19 April 2024
April 19, 2024 @ 22:12 +03:00

GBPUSD Wave Analysis 19 April 2024
April 19, 2024 @ 22:11 +03:00

EURJPY Wave Analysis 18 April 2024
April 18, 2024 @ 23:09 +03:00

EURUSD Wave Analysis 18 April 2024
April 18, 2024 @ 23:08 +03:00