

Technical analysis
Gold Wave Analysis – 06 November , 2018
November 06, 2018 @ 16:13 +03:00
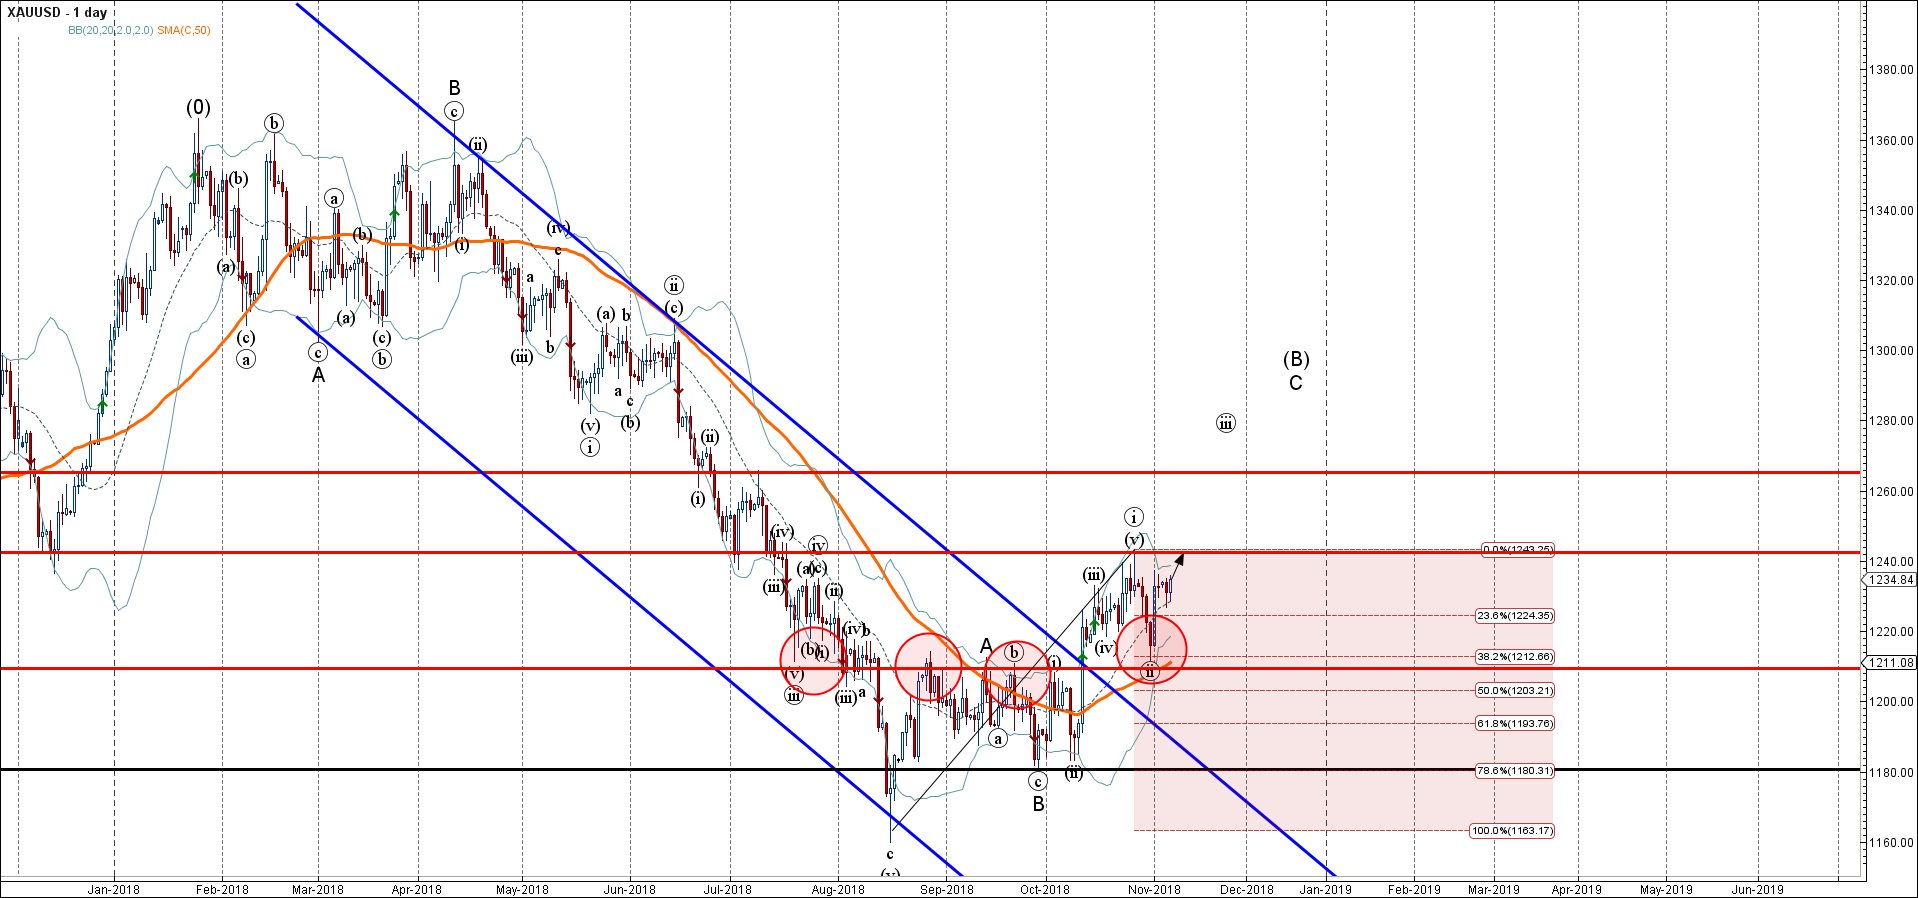
- Gold reversed from support area
- Further gains are likely
Gold continues to rise inside the short-term impulse wave (iii), which started previously from the support zone located between the key support level 1200.00 (former resistance from August and September), 50-day moving average and the 38.2% Fibonacci correction of the previous upward impulse from August.
This support zone was further strengthened by the lower daily Bollinger Band.
Gold is like to rise further and re-test the next resistance level 1242.00 (top of the previous impulse wave (i) from October). Strong support remains at 1200.00.
Related Articles

Intel Wave Analysis 19 April 2024
April 19, 2024 @ 22:12 +03:00

GBPUSD Wave Analysis 19 April 2024
April 19, 2024 @ 22:11 +03:00

EURJPY Wave Analysis 18 April 2024
April 18, 2024 @ 23:09 +03:00

EURUSD Wave Analysis 18 April 2024
April 18, 2024 @ 23:08 +03:00