

Technical analysis
Gold Wave Analysis – 06 February, 2020
February 06, 2020 @ 17:30 +03:00

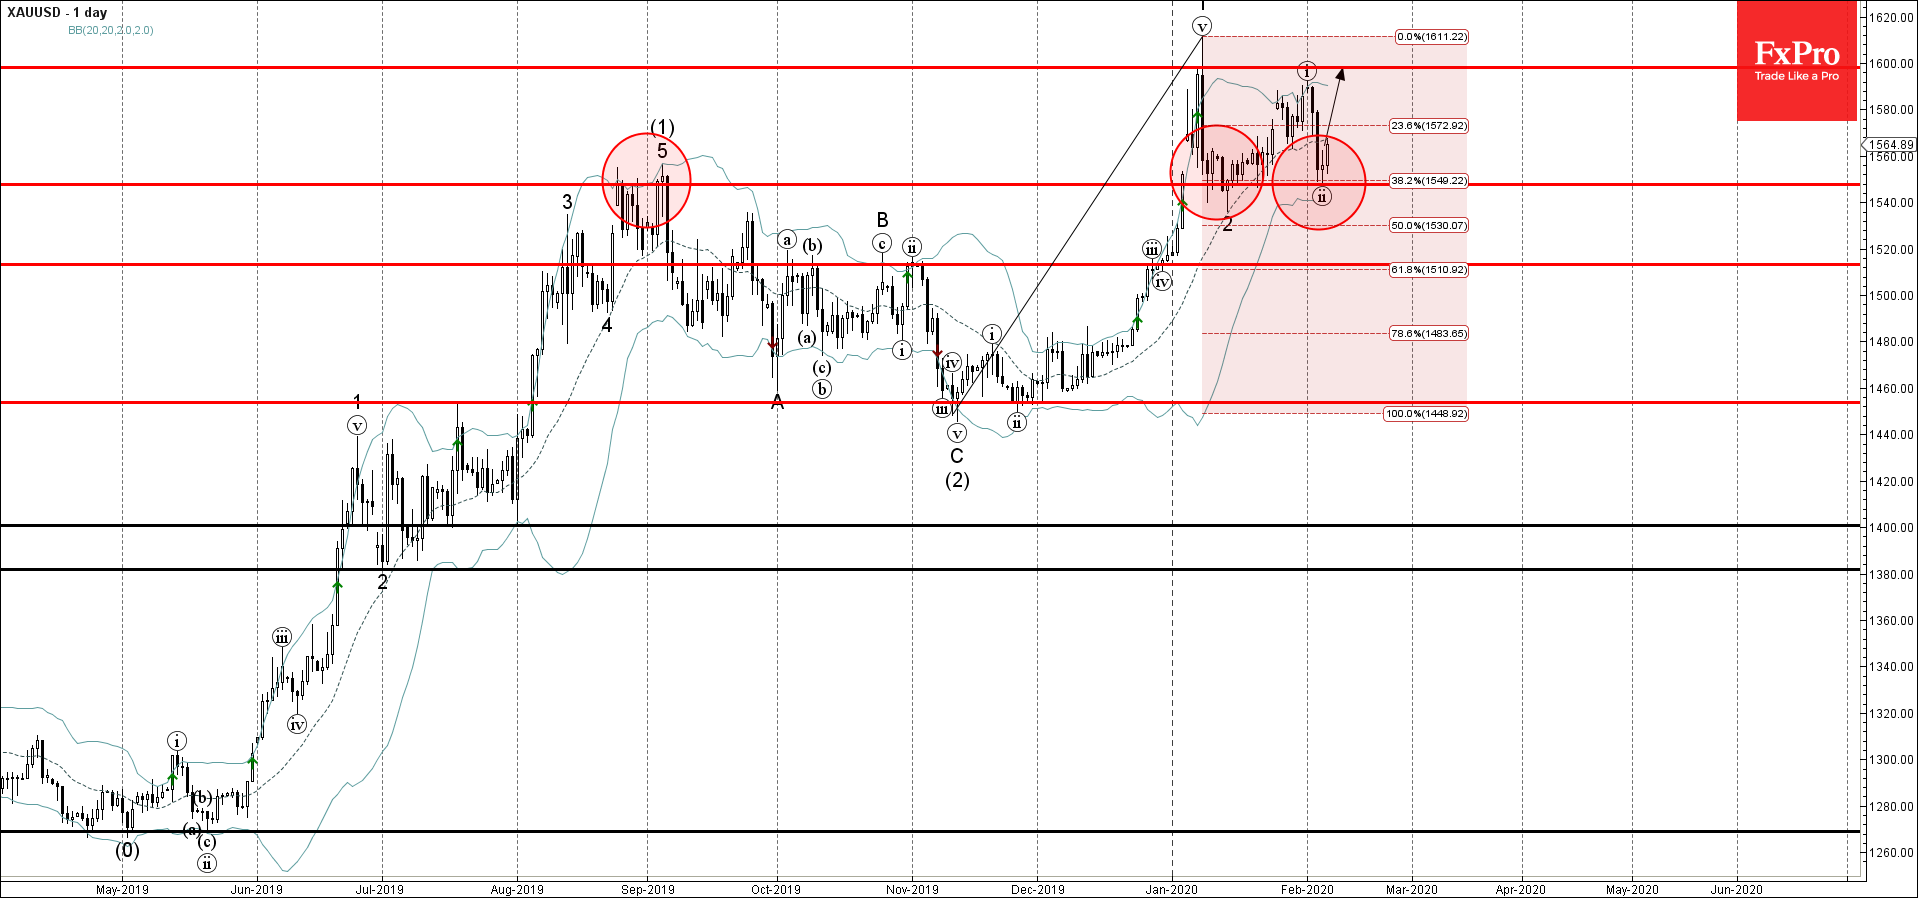
- Gold reversed from support area
- Likely to rise to 1600.00
Gold recently reversed up from the support zone lying between the key support level 1550.00 (former strong resistance from August), lower daily Bollinger Band and the 38.2% Fibonacci correction of the previous upward impulse wave 1.
The upward reversal from this support area started the active short-term impulse wave (iii) – which belongs to the longer-term upward impulse waves 3 and (3).
Gold is likely to rise further toward the next round resistance level 1600.00 (top of the previous impulse wave (i)).
Related Articles

WTI crude oil Wave Analysis 23 April 2024
April 23, 2024 @ 22:47 +03:00

USDCAD Wave Analysis 23 April 2024
April 23, 2024 @ 22:46 +03:00

Intel Wave Analysis 19 April 2024
April 19, 2024 @ 22:12 +03:00

GBPUSD Wave Analysis 19 April 2024
April 19, 2024 @ 22:11 +03:00