

Technical analysis
GBPUSD Wave Analysis 13 October, 2020
October 13, 2020 @ 17:25 +03:00

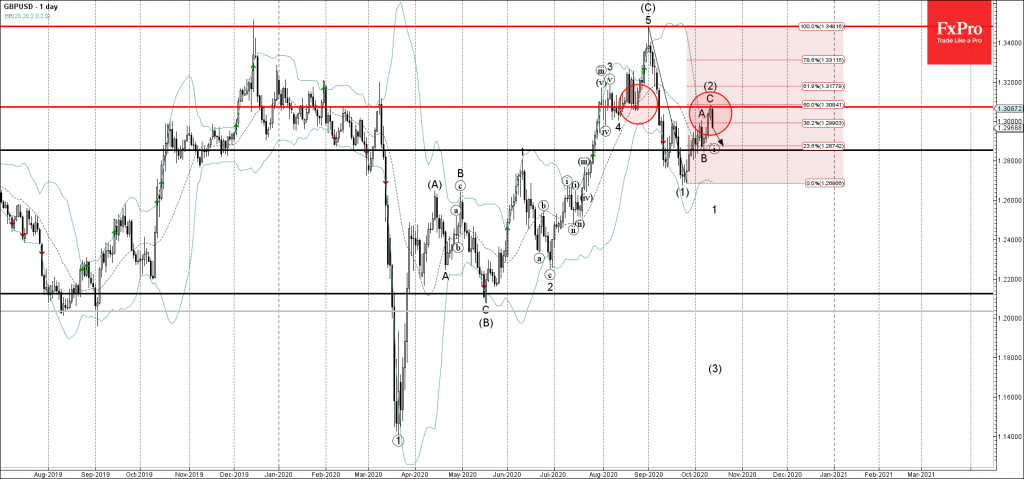
• GBPUSD reversed from resistance area
• Likely to fall 1.2845
GBPUSD recently reversed down from the resistance area lying between the resistance level 1.3075, upper daily Bollinger band and the 50% Fibonacci correction of the downward impulse (1) from August.
The downward reversal from this resistance area stopped the previous medium-term ABC correction (2).
GBPUSD is likely to fall further toward the next support level 1.2845 (low of the previous minor corrective wave B from the start of October).
Related Articles

Intel Wave Analysis 19 April 2024
April 19, 2024 @ 22:12 +03:00

GBPUSD Wave Analysis 19 April 2024
April 19, 2024 @ 22:11 +03:00

EURJPY Wave Analysis 18 April 2024
April 18, 2024 @ 23:09 +03:00

EURUSD Wave Analysis 18 April 2024
April 18, 2024 @ 23:08 +03:00