

Technical analysis
GBPCAD Wave Analysis – 15 May, 2019
May 15, 2019 @ 18:37 +03:00

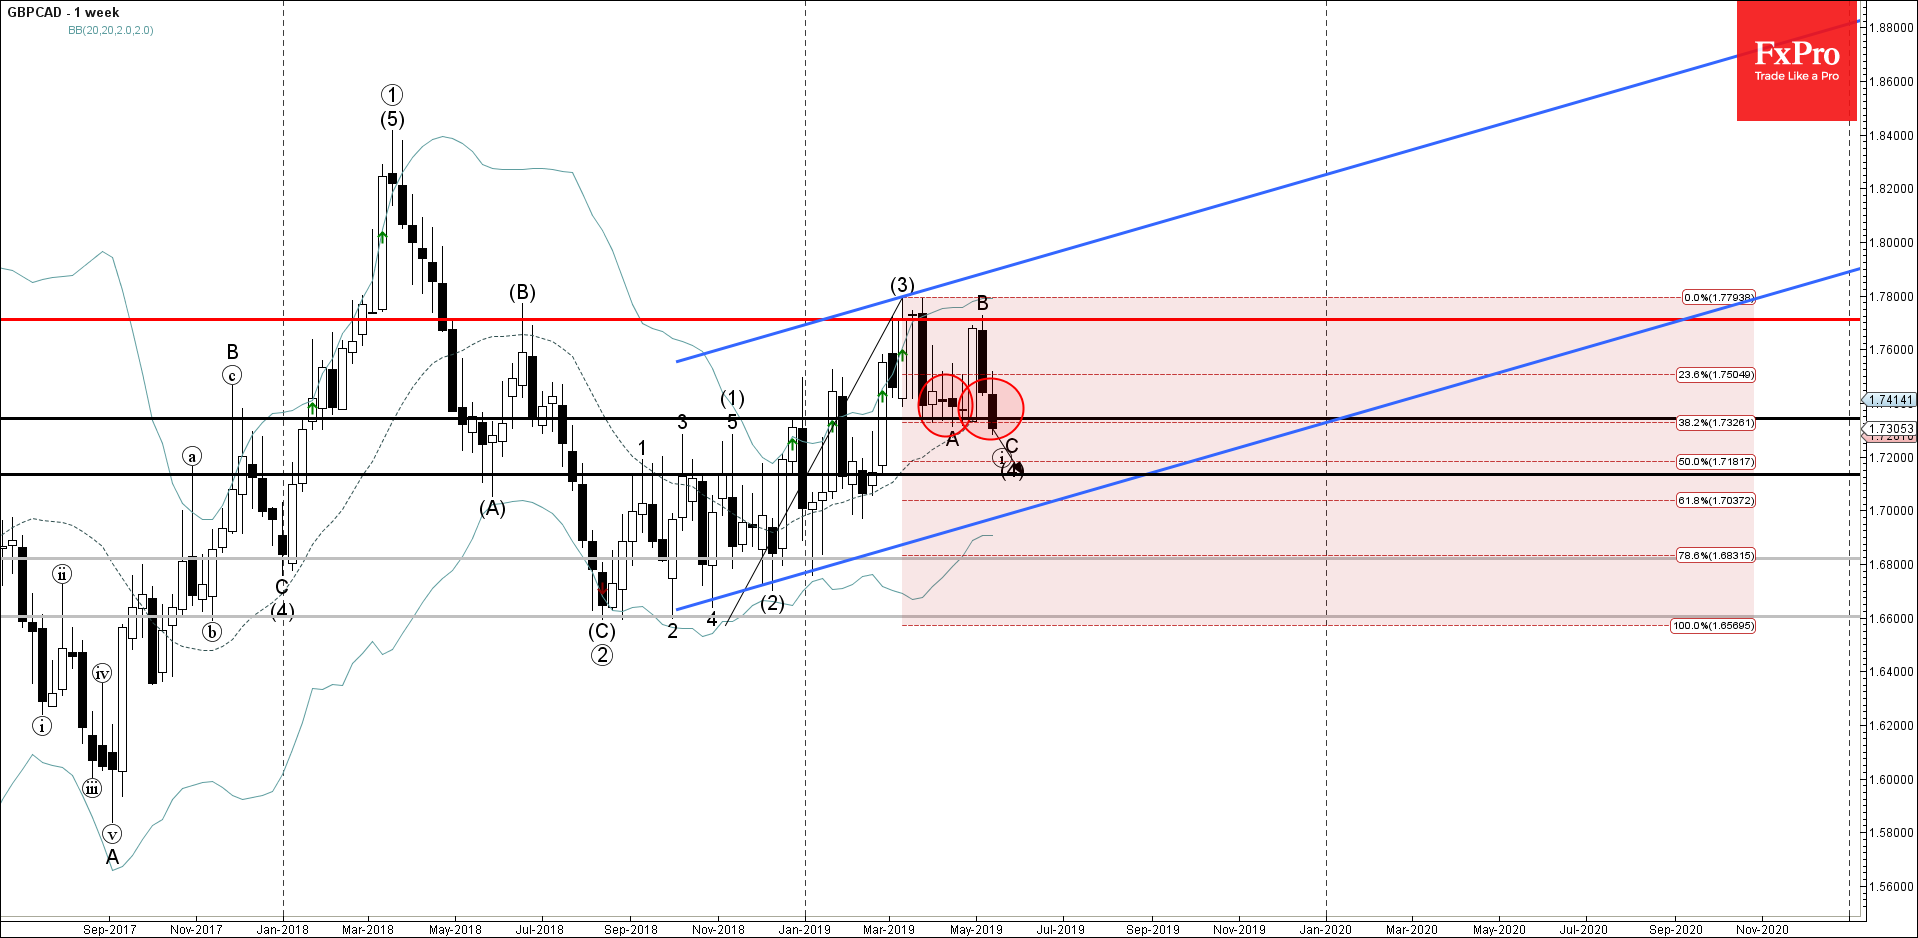
- GBPCAD broke support area
- Further losses are likely
GBPCAD recently broke the support area lying between the pivotal support level 1.7340 (which has been reversing the price in the last few weeks) and the 38.2% Fibonacci correction of the previous upward impulse from last November.
The breakout of this support area should accelerate the active impulse wave C of the ABC correction (4) from March.
GBPCAD is expected to fall further and retest the next support level 1.7140 (target price for the completion of the active correction (4)).
Related Articles

EURGBP Wave Analysis 24 April 2024
April 24, 2024 @ 21:42 +03:00

EURJPY Wave Analysis 24 April 2024
April 24, 2024 @ 21:40 +03:00

WTI crude oil Wave Analysis 23 April 2024
April 23, 2024 @ 22:47 +03:00

USDCAD Wave Analysis 23 April 2024
April 23, 2024 @ 22:46 +03:00