

Technical analysis
GBPCAD Wave Analysis – 07 November, 2019
November 07, 2019 @ 17:06 +03:00

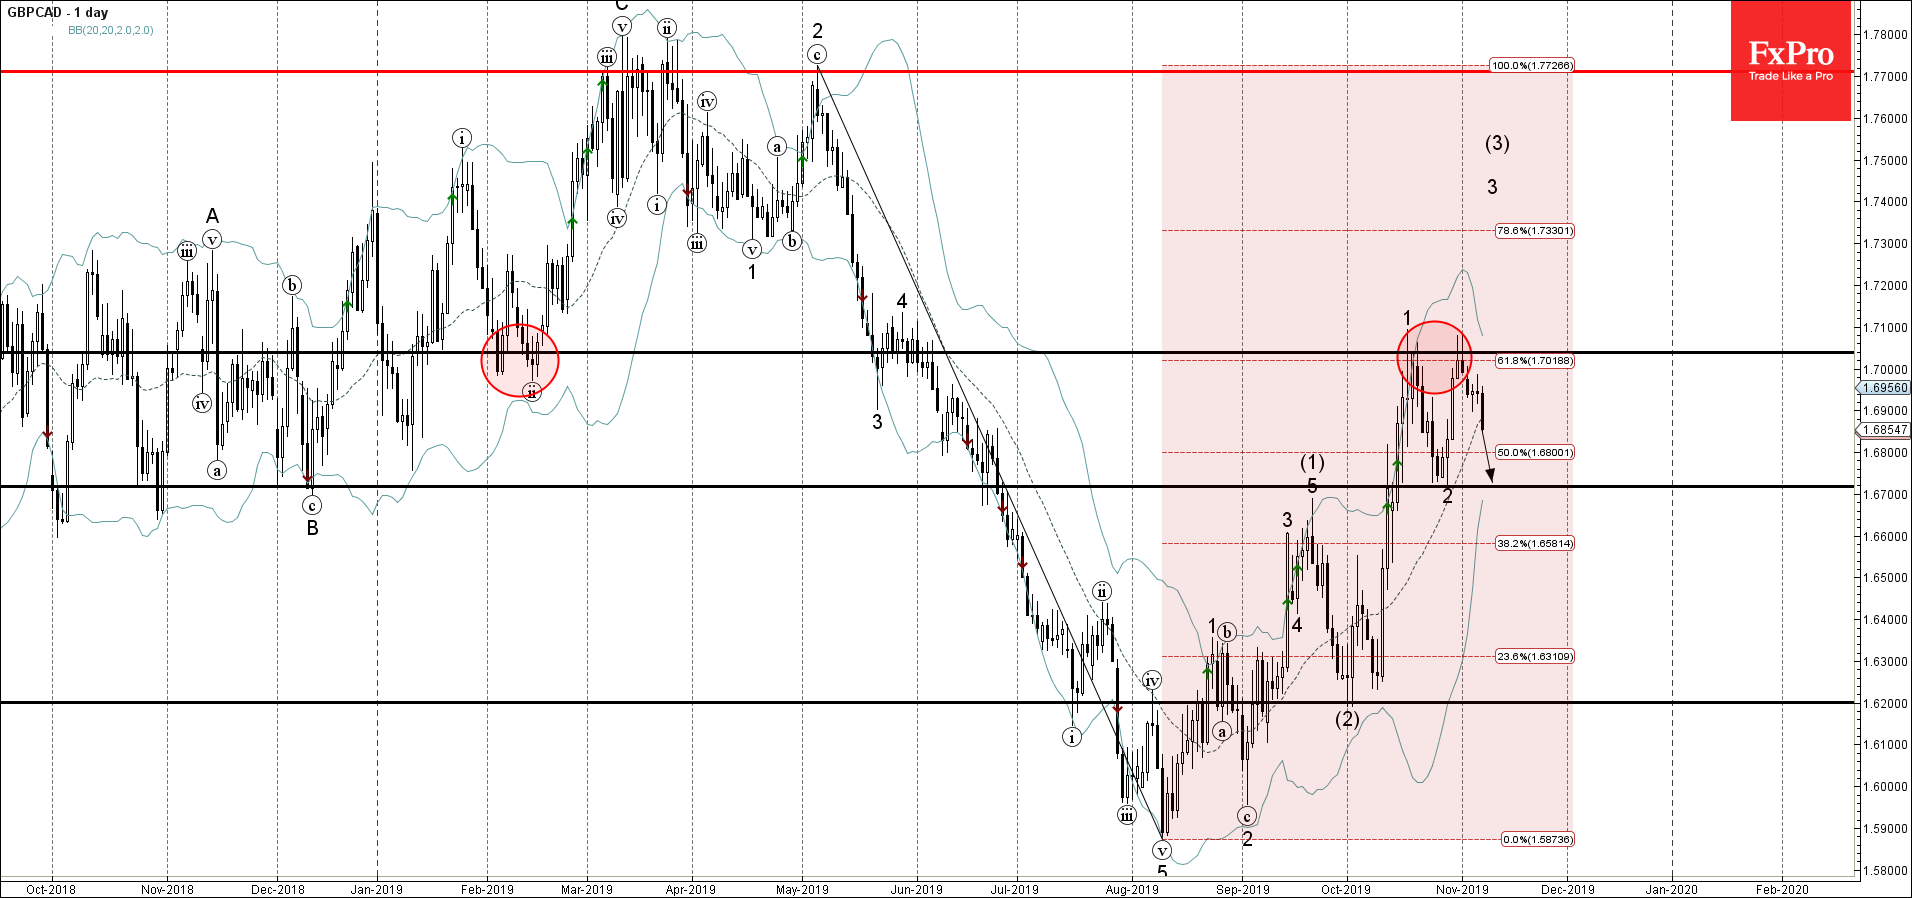
- GBPCAD reversed from resistance zone
- Likely to fall to 1.6700
GBPCAD recently reversed down from resistance zone lying between the strong resistance level 1.7040 (top of the previous impulse wave 1), upper daily Bollinger Band and the 61.8% Fibonacci correction of the previous downward impulse from May.
The downward reversal from this resistance area stopped the earlier impulse wave 3 and (3).
GBPCAD is expected to fall further and retest the next support level – 1.6700 (low of the earlier correction 2).
Related Articles

Intel Wave Analysis 19 April 2024
April 19, 2024 @ 22:12 +03:00

GBPUSD Wave Analysis 19 April 2024
April 19, 2024 @ 22:11 +03:00

EURJPY Wave Analysis 18 April 2024
April 18, 2024 @ 23:09 +03:00

EURUSD Wave Analysis 18 April 2024
April 18, 2024 @ 23:08 +03:00