

Technical analysis
EURGBP Wave Analysis – 04 Janaury, 2019
January 04, 2019 @ 18:28 +03:00

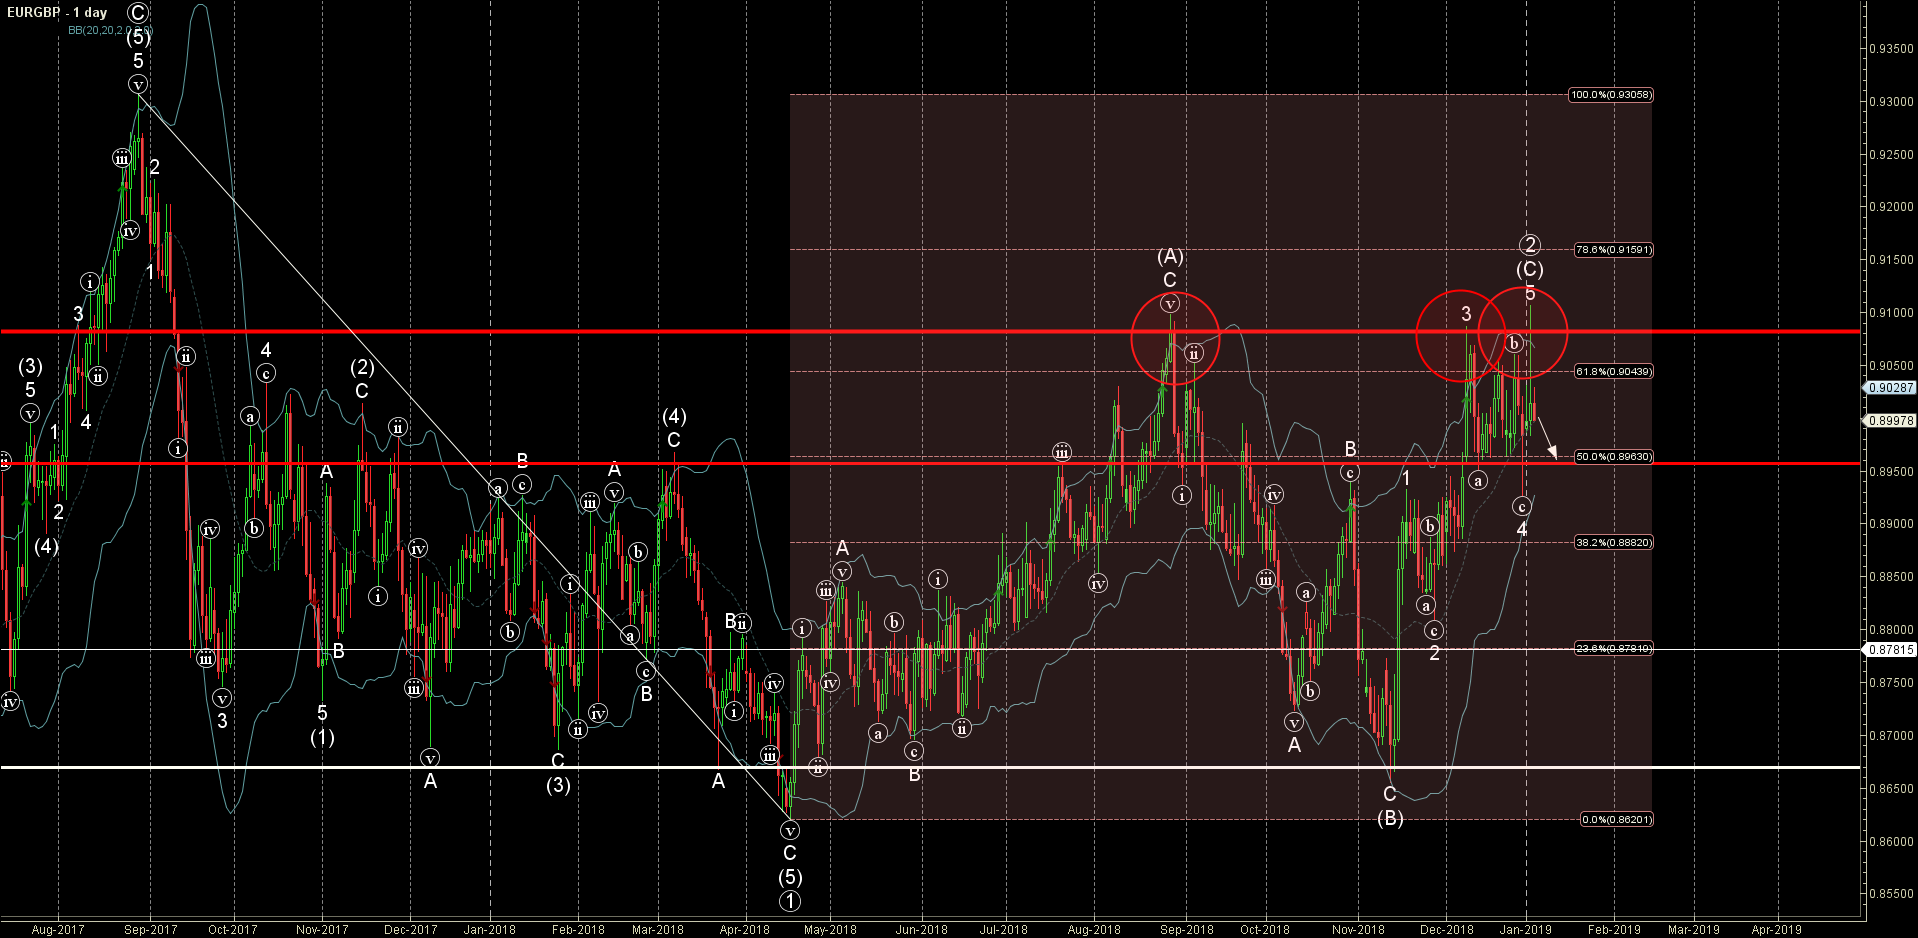
- EURGBP reversed from resistance area
- Further losses are likely
EURGBP recently reversed down from the resistance zone lying between the strong resistance level 0.9080 (which has been reversing the price from the end of August, as can be seen below), upper daily Bollinger Band and the 61.8% Fibonacci correction of the previous downward impulse from last August.
The downward reversal from this resistance zone created the daily Japanese candlesticks reversal pattern Shooting Star.
EURGBP is expected to fall further and re-test the next support level 0.8950 (which reversed the previous waves (a) and 4).
Related Articles

EURJPY Wave Analysis 18 April 2024
April 18, 2024 @ 23:09 +03:00

EURUSD Wave Analysis 18 April 2024
April 18, 2024 @ 23:08 +03:00

WTI Wave Analysis 17 April 2024
April 17, 2024 @ 22:40 +03:00

EURGBP Wave Analysis 17 April 2024
April 17, 2024 @ 22:38 +03:00