

Technical analysis
Cotton Wave Analysis – 20 August, 2019
August 20, 2019 @ 16:54 +03:00

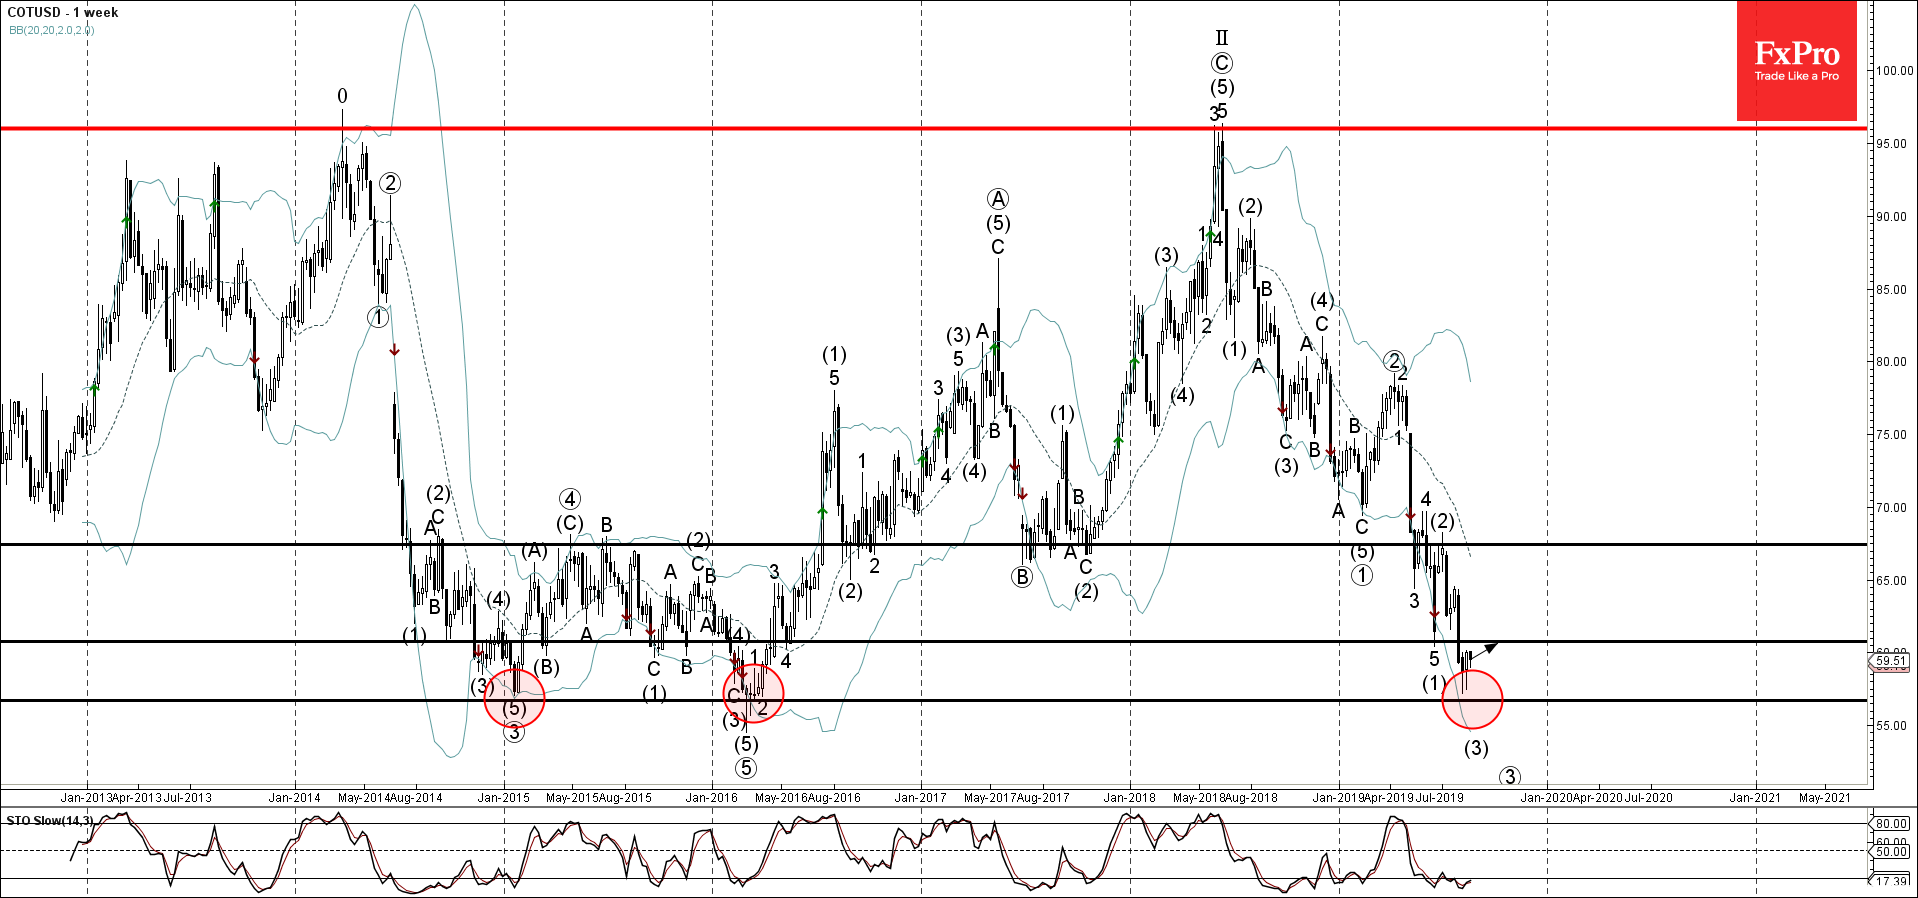
- Cotton reversed from support area
- Further gains are likely
Cotton recently reversed up from the support area lying between the multi-year support level 56.70 (which has been reversing the price from 2015) and the lower weekly Bollinger Band.
The upward reversal from this support area created the two consecutive weekly Japanese candlesticks reversal patterns – Hammer.
Given the oversold weekly Stochastic indicator – Cotton is expected to rise further and retest the next resistance level 60.70.
Related Articles

EURGBP Wave Analysis 24 April 2024
April 24, 2024 @ 21:42 +03:00

EURJPY Wave Analysis 24 April 2024
April 24, 2024 @ 21:40 +03:00

WTI crude oil Wave Analysis 23 April 2024
April 23, 2024 @ 22:47 +03:00

USDCAD Wave Analysis 23 April 2024
April 23, 2024 @ 22:46 +03:00