

Technical analysis
Cotton Wave Analysis – 08 February, 2019
February 08, 2019 @ 18:25 +03:00

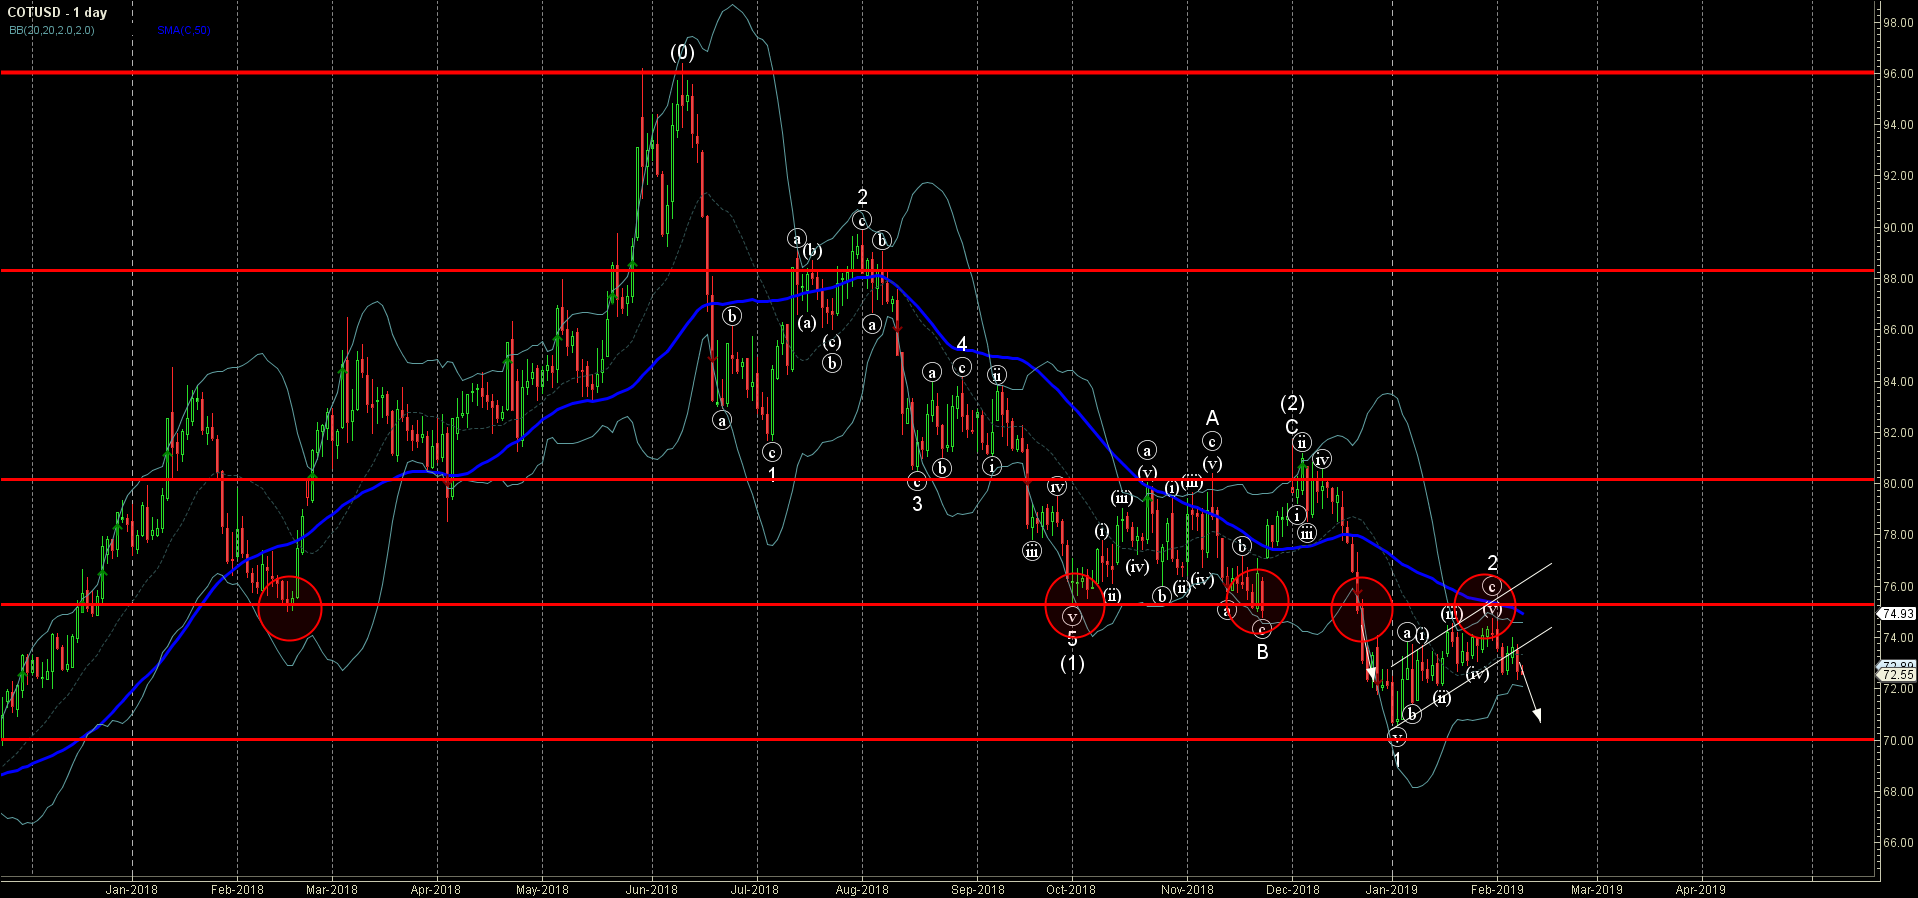
- Cotton reversed from resistance area
- Further losses are likely
Cotton recently reversed down from the resistance area lying between the strong resistance level 75.30 (former multi-month support from February), upper daily Bollinger Band and the 50-day moving average.
The downward reversal from this resistance area started the active impulse wave 3 – which recently broke the daily up channel from the start of January.
Cotton is expected to fall further and re-test the next round support level 70.00 (low of the previous impulse wave 1).
Related Articles

WTI crude oil Wave Analysis 23 April 2024
April 23, 2024 @ 22:47 +03:00

USDCAD Wave Analysis 23 April 2024
April 23, 2024 @ 22:46 +03:00

Intel Wave Analysis 19 April 2024
April 19, 2024 @ 22:12 +03:00

GBPUSD Wave Analysis 19 April 2024
April 19, 2024 @ 22:11 +03:00