

Technical analysis
Corn Wave Analysis – 16 July, 2019
July 16, 2019 @ 17:06 +03:00

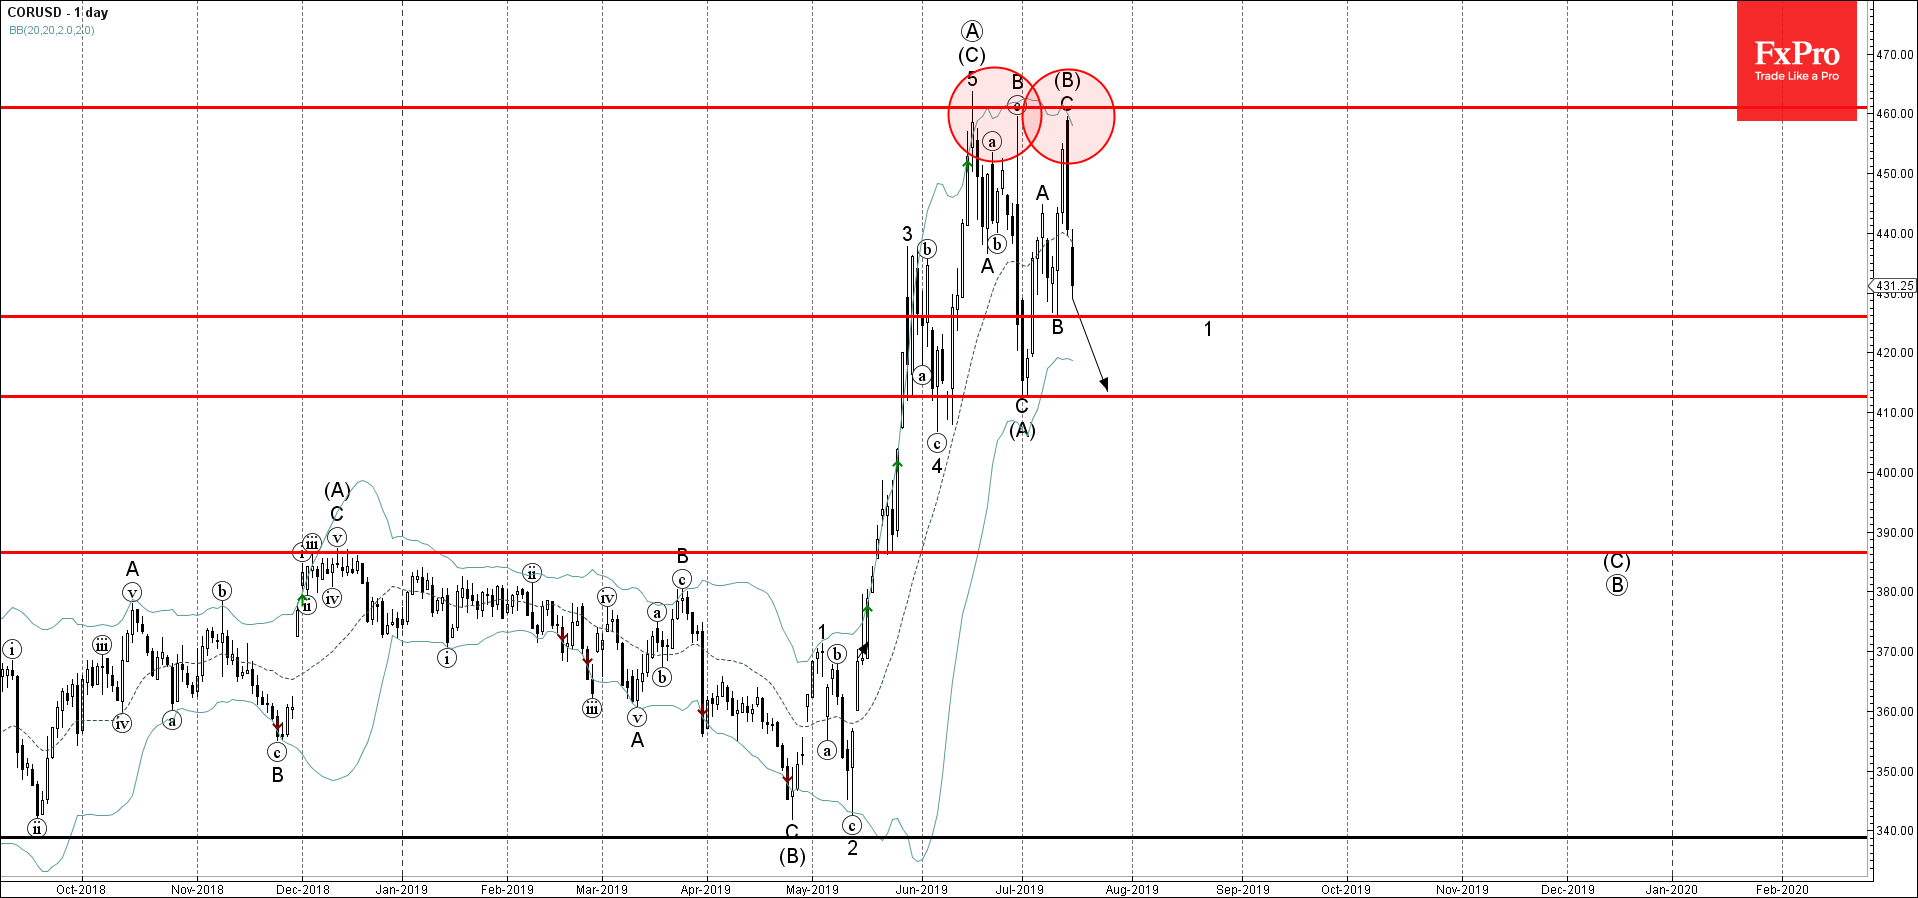
- Corn reversed from resistance area
- Further losses are likely
Corn recently reversed down from the resistance area lying between the key resistance level 460.00 (which reversed the previous waves (C) and B) and the upper daily Bollinger Band.
The downward reversal from this resistance area started the active impulse wave (C).
Corn is expected to fall further and retest the next support levels 426.00 (low of wave B) – followed by 412.70 (low of wave (A)).
Related Articles

WTI crude oil Wave Analysis 23 April 2024
April 23, 2024 @ 22:47 +03:00

USDCAD Wave Analysis 23 April 2024
April 23, 2024 @ 22:46 +03:00

Intel Wave Analysis 19 April 2024
April 19, 2024 @ 22:12 +03:00

GBPUSD Wave Analysis 19 April 2024
April 19, 2024 @ 22:11 +03:00