

Technical analysis
Copper Wave Analysis – 12 February, 2019
February 12, 2019 @ 17:51 +03:00

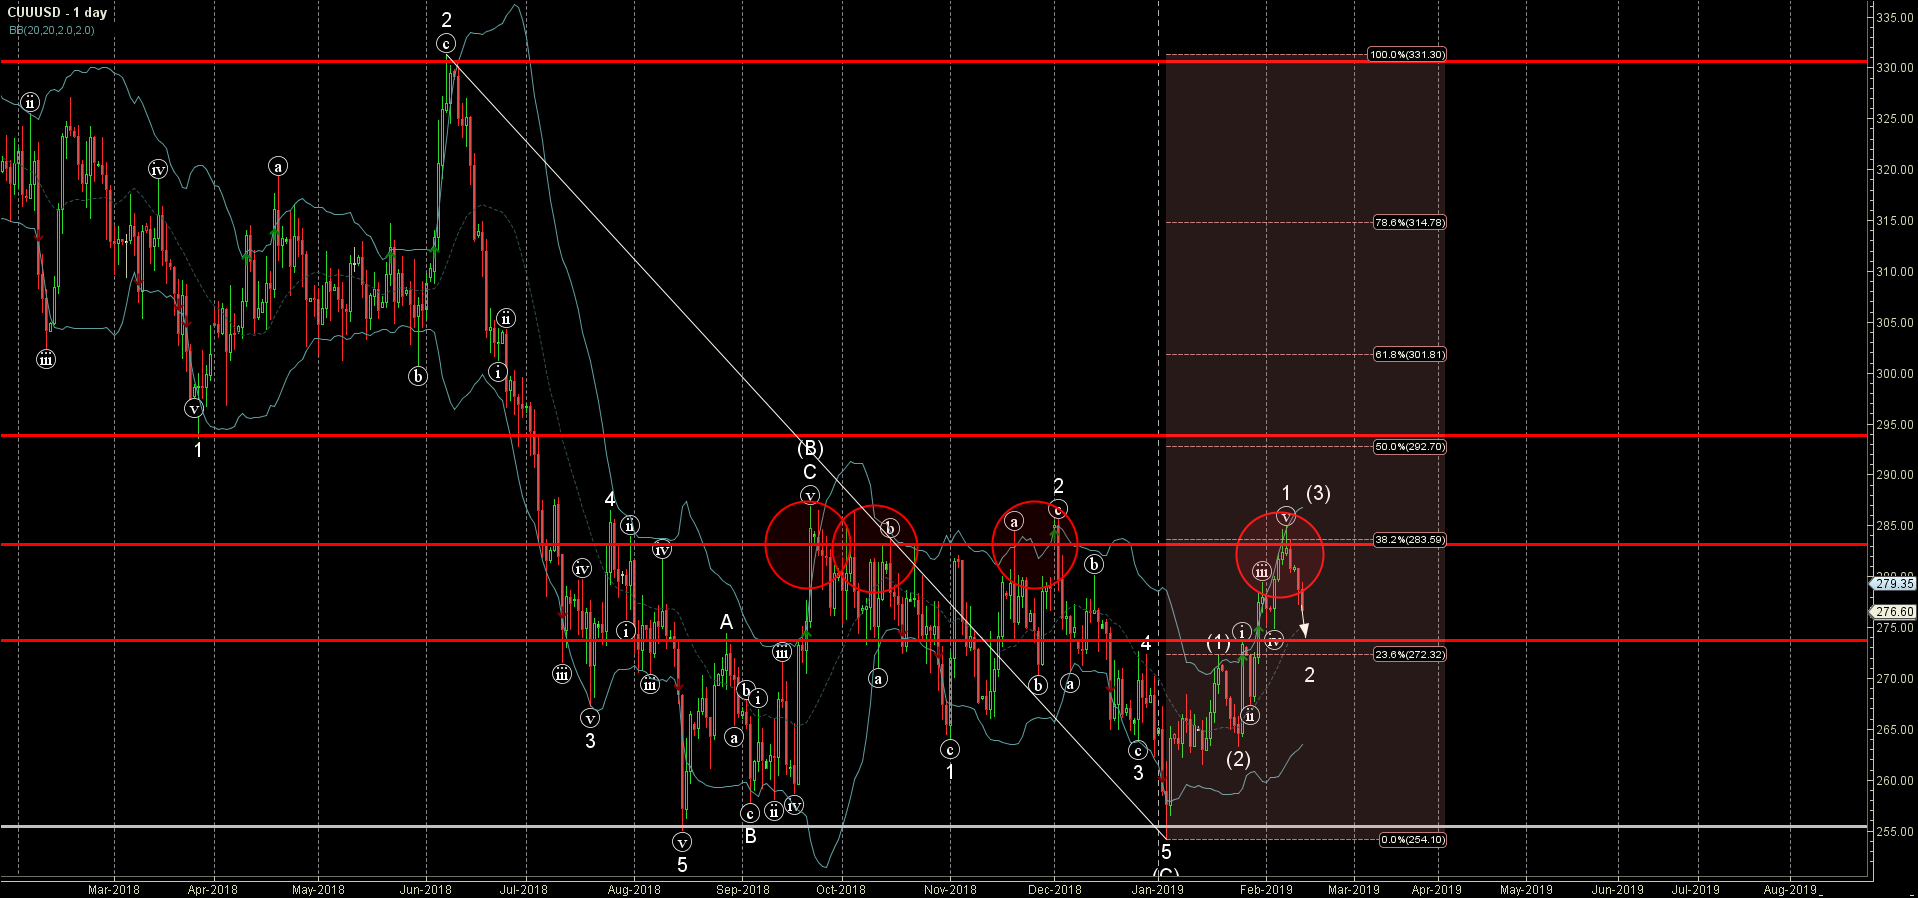
- Copper reversed from resistance area
- Further losses are likely
Copper recently reversed down from the resistance area lying between the strong resistance level 283.00 (which has been steadily reversing the price from the start of October), upper daily Bollinger Band and the 38.2% Fibonacci correction of the previous sharp downward impulse from June.
The downward reversal from this resistance area started the active short-term corrective wave 2.
Copper is expected to fall further and re-test the next support level 273.67 (former resistance from the end of January).
Related Articles

EURJPY Wave Analysis 18 April 2024
April 18, 2024 @ 23:09 +03:00

EURUSD Wave Analysis 18 April 2024
April 18, 2024 @ 23:08 +03:00

WTI Wave Analysis 17 April 2024
April 17, 2024 @ 22:40 +03:00

EURGBP Wave Analysis 17 April 2024
April 17, 2024 @ 22:38 +03:00