

Technical analysis
Copper Wave Analysis – 08 March, 2019
March 08, 2019 @ 16:24 +03:00

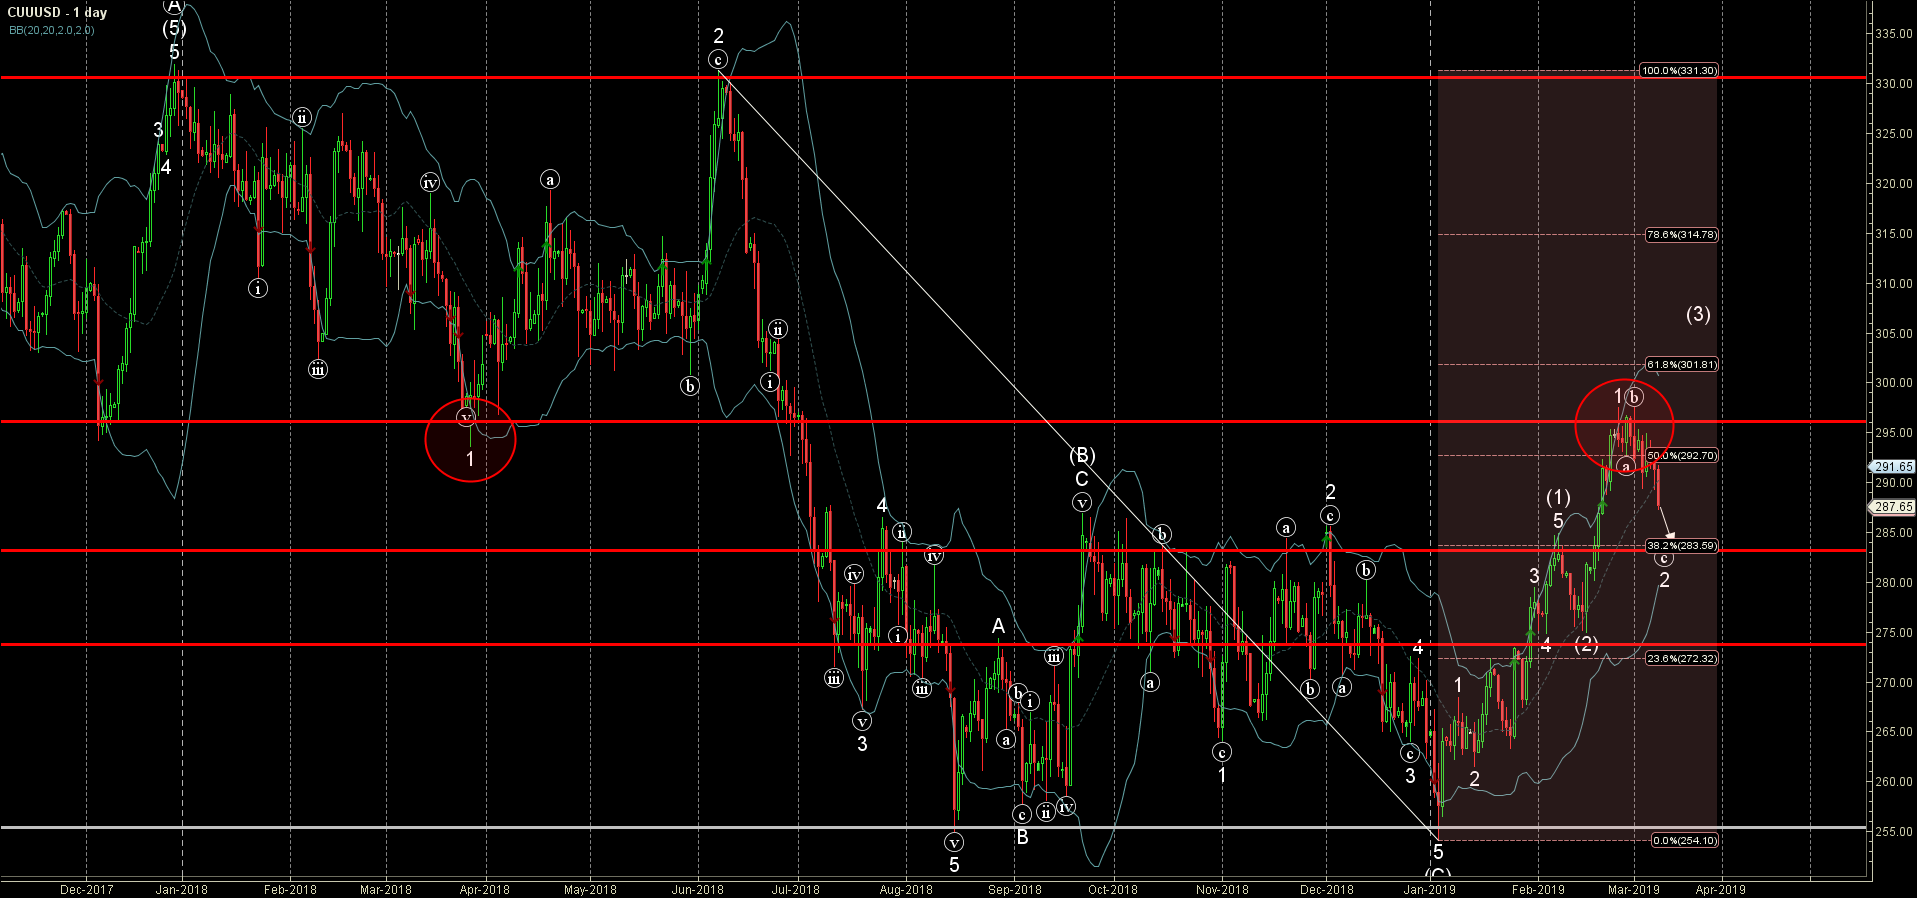
- Copper reversed from resistance area
- Further losses are likely
Copper recently reversed down from the resistance area lying between the pivotal resistance level 296.00 (former multi-month support from March of 2018 and December of 2017), upper daily Bollinger Band and the 50% Fibonacci correction of the previous downward impulse from June.
The downward reversal from this resistance area started the active short-term ABC correction 2.
Copper is expected to fall further and re-test the next round support level 285.00 (former strong resistance from November and December).
Related Articles

EURGBP Wave Analysis 24 April 2024
April 24, 2024 @ 21:42 +03:00

EURJPY Wave Analysis 24 April 2024
April 24, 2024 @ 21:40 +03:00

WTI crude oil Wave Analysis 23 April 2024
April 23, 2024 @ 22:47 +03:00

USDCAD Wave Analysis 23 April 2024
April 23, 2024 @ 22:46 +03:00