

Technical analysis
CADCHF Wave Analysis – 26 December , 2018
December 26, 2018 @ 16:06 +03:00

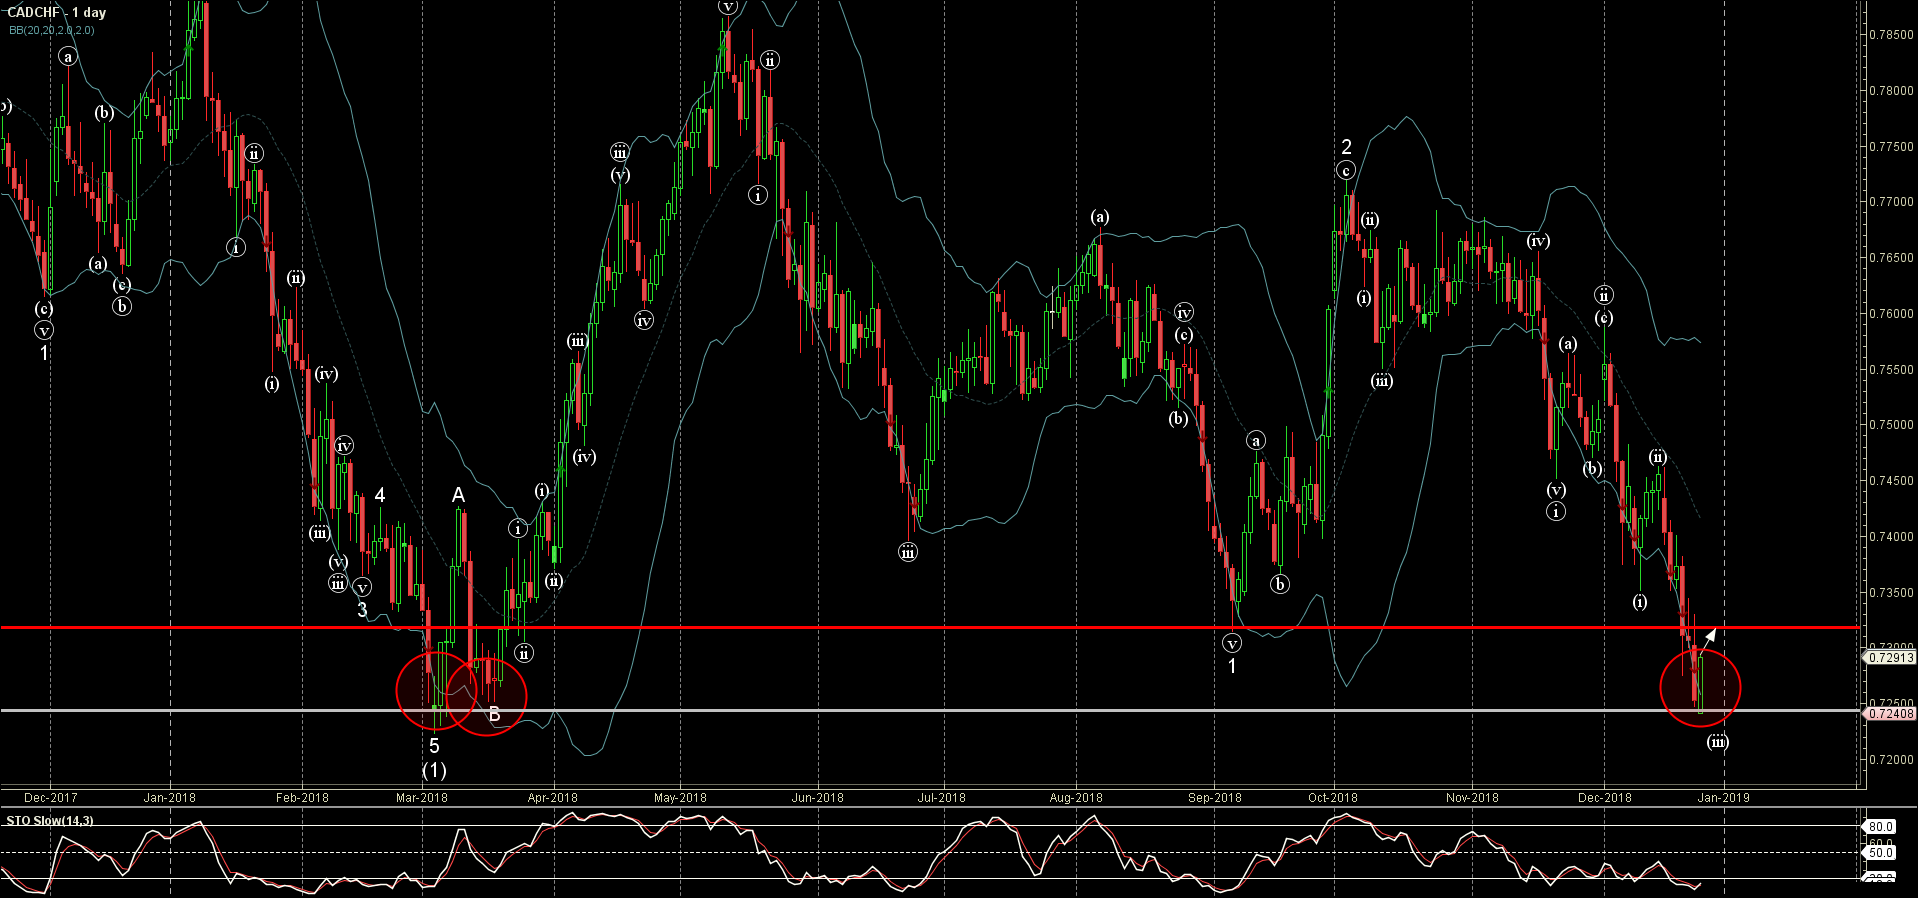
- CADCHF reversed from support area
- Further gains are likely
FxPro analyst said that CADCHF recently reversed up from the support area lying between the long-term support level 0.7250 (which previously reversed the price twice in March) and the lower daily Bollinger Band.
The upward reversal from this support area stopped the previous short-term downward impulse wave 3 from the start of October.
Given the oversold reading on the daily Stochastic indicator – CADCHF is expected to rise further and re-test the next resistance level 0.7320 (former strong support from September).
Related Articles

EURGBP Wave Analysis 24 April 2024
April 24, 2024 @ 21:42 +03:00

EURJPY Wave Analysis 24 April 2024
April 24, 2024 @ 21:40 +03:00

WTI crude oil Wave Analysis 23 April 2024
April 23, 2024 @ 22:47 +03:00

USDCAD Wave Analysis 23 April 2024
April 23, 2024 @ 22:46 +03:00