

Technical analysis
AUDCHF Wave Analysis – 11 Janaury, 2019
January 11, 2019 @ 15:43 +03:00

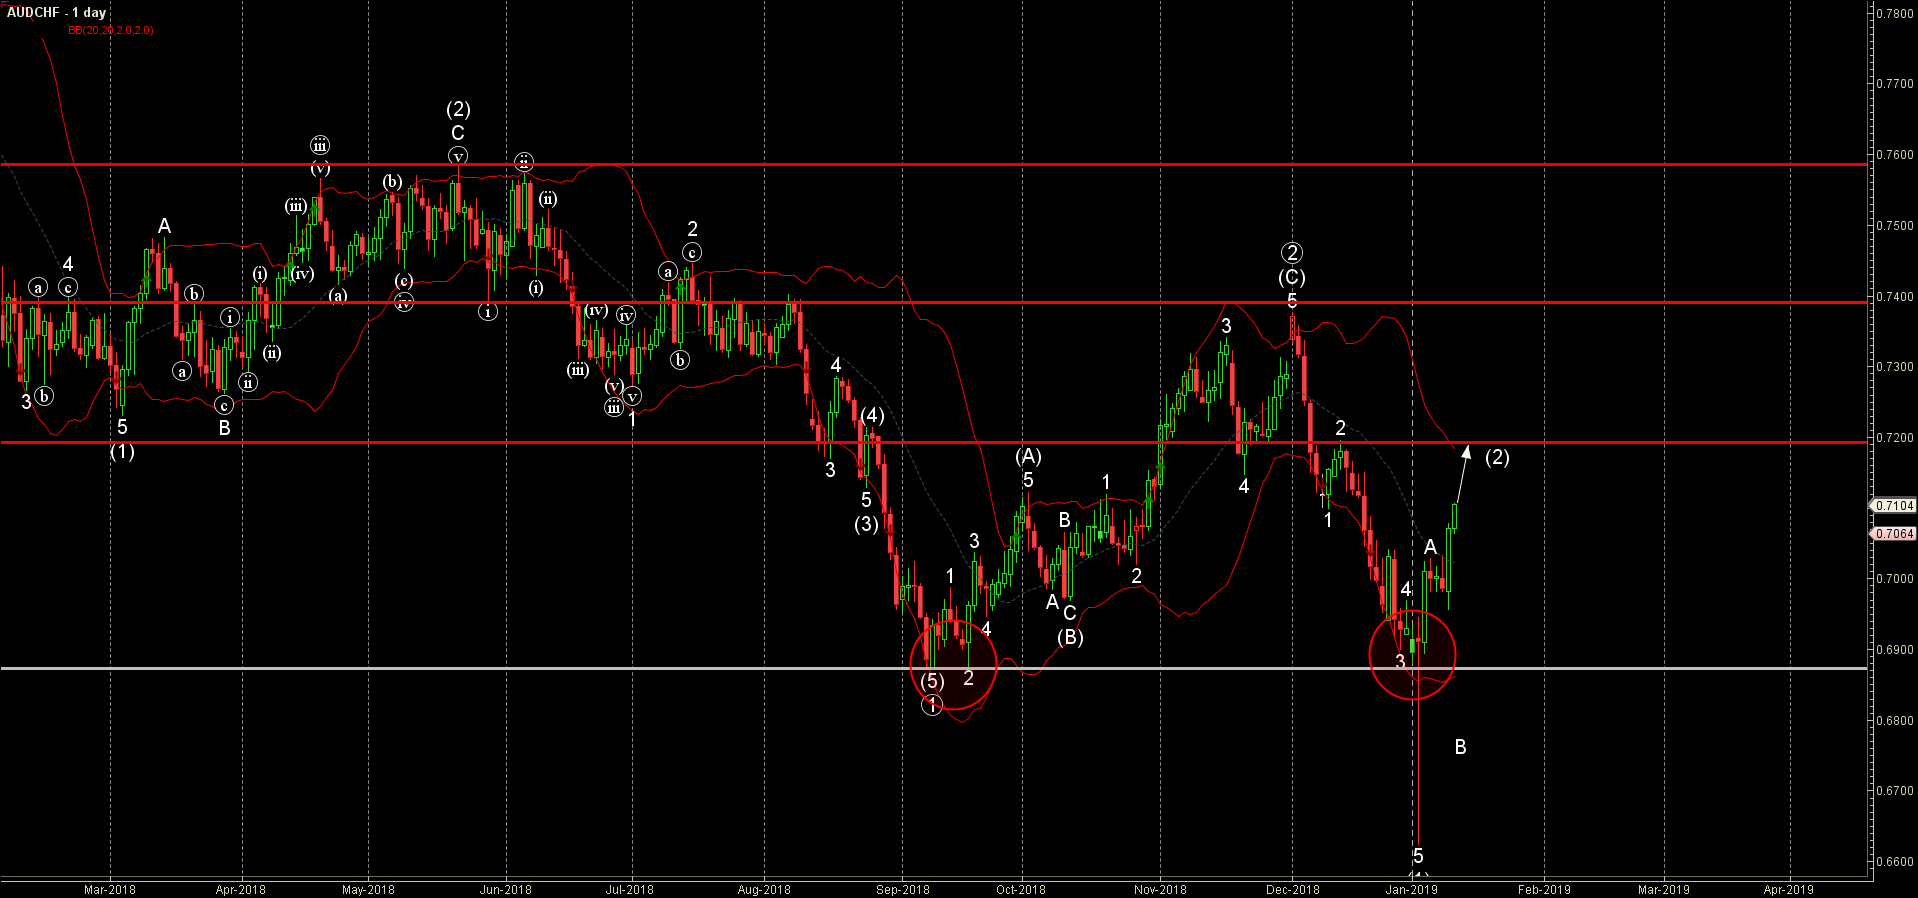
- AUDCHF reversed from support area
- Further gains are likely
AUDCHF recently reversed up from the key support area lying between the support level 0.6870 (which reversed the price twice in September) and the lower daily Bollinger Band.
The upward reversal from this support area created the daily Japanese candlesticks reversal pattern Hammer – which started the active medium-term ABC correction (2).
AUDCHF is expected to rise further and re-test the next resistance level 0.7250 (target price for the completion of the active wave (2) and the top of the previous correction 2).
Related Articles

Intel Wave Analysis 19 April 2024
April 19, 2024 @ 22:12 +03:00

GBPUSD Wave Analysis 19 April 2024
April 19, 2024 @ 22:11 +03:00

EURJPY Wave Analysis 18 April 2024
April 18, 2024 @ 23:09 +03:00

EURUSD Wave Analysis 18 April 2024
April 18, 2024 @ 23:08 +03:00