

Technical analysis
AUDCAD Wave Analysis 28 September, 2020
September 28, 2020 @ 17:16 +03:00

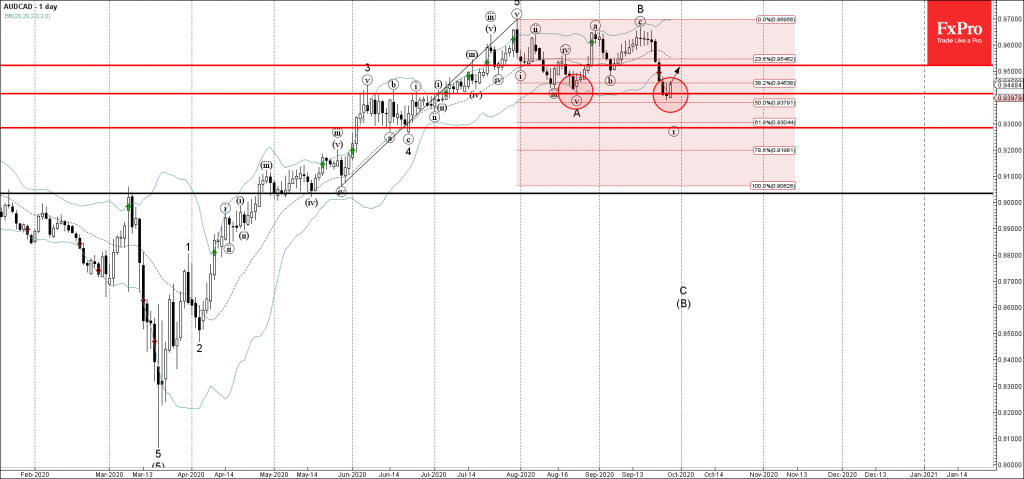
• AUDCAD reversed from support zone
• Likely to rise to 0.9500
AUDCAD recently reversed up from the support zone located between the key support level 0.9415 (low of the previous correction A), lower daily Bollinger Band and the 50% Fibonacci correction of the upward impulse from May.
If the price closes today near the active levels it will form the daily candlestick reversal pattern Morning Star.
AUDCAD is expected to rise further toward the next resistance level 0.9500 (former low of the minor corrective wave (b) from the start of September).
Related Articles

EURGBP Wave Analysis 24 April 2024
April 24, 2024 @ 21:42 +03:00

EURJPY Wave Analysis 24 April 2024
April 24, 2024 @ 21:40 +03:00

WTI crude oil Wave Analysis 23 April 2024
April 23, 2024 @ 22:47 +03:00

USDCAD Wave Analysis 23 April 2024
April 23, 2024 @ 22:46 +03:00