

Technical analysis
AUDCAD Wave Analysis – 24 July, 2019
July 24, 2019 @ 16:21 +03:00

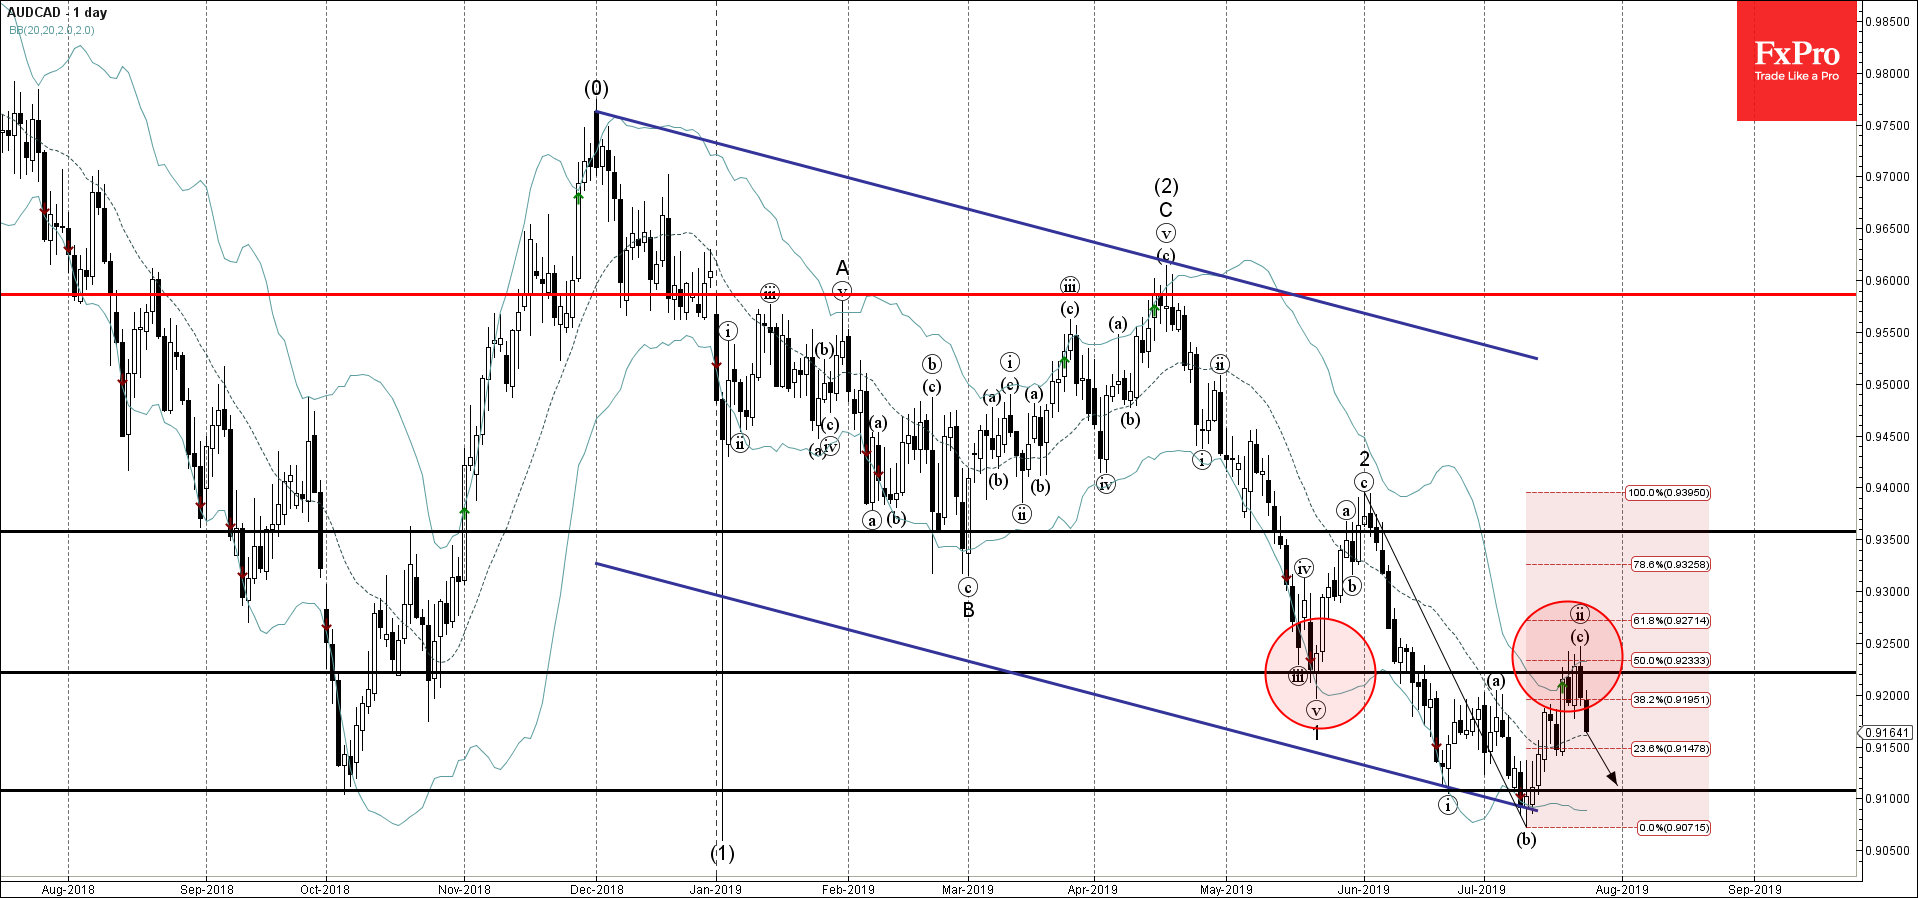
- AUDCAD reversed from resistance area
- Further losses are likely
AUDCAD recently reversed down from the resistance area lying between the key resistance level 0.92200 (former strong support from May) and the upper daily Bollinger Band.
The downward reversal form this resistance area created the daily Japanese candlesticks reversal pattern Bearish Engulfing.
AUDCAD is expected to fall further and retest the next support level 0.9100 (which stopped the previous waves i) and (b)).
Related Articles

GBPCAD Wave Analysis 25 April 2024
April 25, 2024 @ 20:10 +03:00

GBPAUD Wave Analysis 25 April 2024
April 25, 2024 @ 20:09 +03:00

EURGBP Wave Analysis 24 April 2024
April 24, 2024 @ 21:42 +03:00

EURJPY Wave Analysis 24 April 2024
April 24, 2024 @ 21:40 +03:00