


The sell-off in gold is a bit underwhelming
July 27, 2022 @ 12:18 +03:00
Gold is holding steady ahead of the FOMC rate decision. Such a lull is often the prologue to a good move. Gold has been moving in a broad sideways loop of $1680-$2070 after solid gains for almost two years.
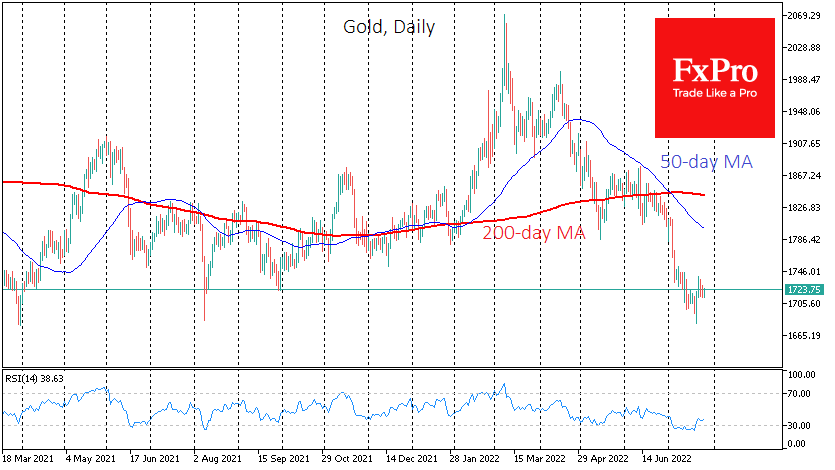
At the current levels near $1720, gold is consolidating near the 61.8% Fibonacci level of the two-year trend from August 2018 to August 2020. Last week, the price briefly dipped below $1680, touching the lower end of a two-year consolidation range. However, the sell-off did not continue, and the price quickly returned to levels above $1700.
On the technical analysis side, gold did not enter the oversold area on the weekly RSI charts. In the previous ten years, moving from the overbought or oversold area to the “normal territory” between 30-70 was the formal start of the massive countertrend move, or it marked the end of it.
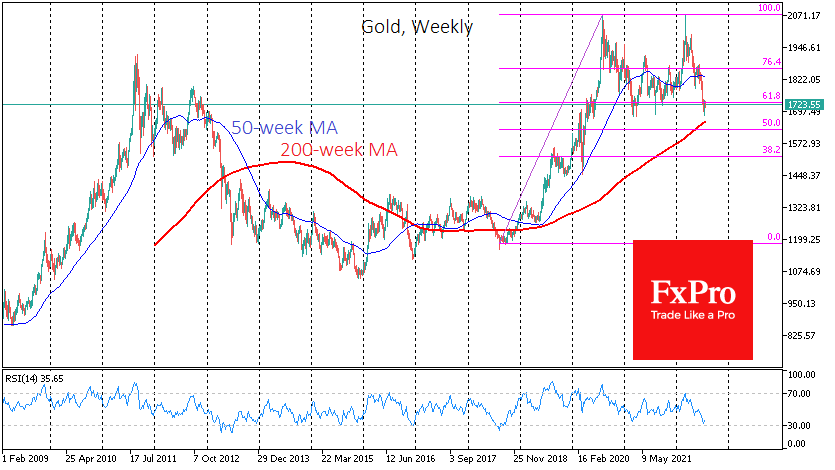
We also expected that the sellers of gold would push its price to the 200-week moving average line, following Bitcoin’s example. That line is now near $1655, and last week’s sell-off only stopped at $20 from there, though the price has not been shy about crossing that line over the previous six years.
The technically uncompleted sell-off in gold, combined with the recent lull – rebalancing – causes us to prepare for another wave of sell-off in gold on today’s FOMC decision or on the release of the preliminary Q2 GDP estimates later in the week.

At the same time, we cannot overlook several factors supporting buyers. Gold is holding up relatively well in the face of unprecedented monetary policy tightening and a slowing global economy. Ten years ago, in similar macro circumstances, the price gave up around 70% of the previous rally.
It is often the case that August-September lays the foundations for a new long-term trend in gold. And this time, it could be the return of a bull market. Today’s FOMC decision may mark the peak of the hawks, and other monetary policy decisions will be less aggressive.
Also, do not be overly fearful of today’s Fed 75–100-point hike. In 2015, the first rate hike since the global financial crisis marked the low point for gold in that cycle.
On balance, we have a significant concentration of factors around gold. A sharp dip under 1650 and subsequent sustained pressure in the coming days could be the first sign that the bears have not tired, and it may make sense to talk about a decline in gold lasting up to several years after that. Increased buying in a near oversold asset could signal that the two-year sideways slide is over and that gold will shine again, renewing record highs as early as next year.
The FxPro AnalystTeam