Signs of a USDCAD Reversal
December 31, 2024 @ 13:27 +03:00
The Canadian dollar may be consolidating a corrective pullback from multi-year highs.
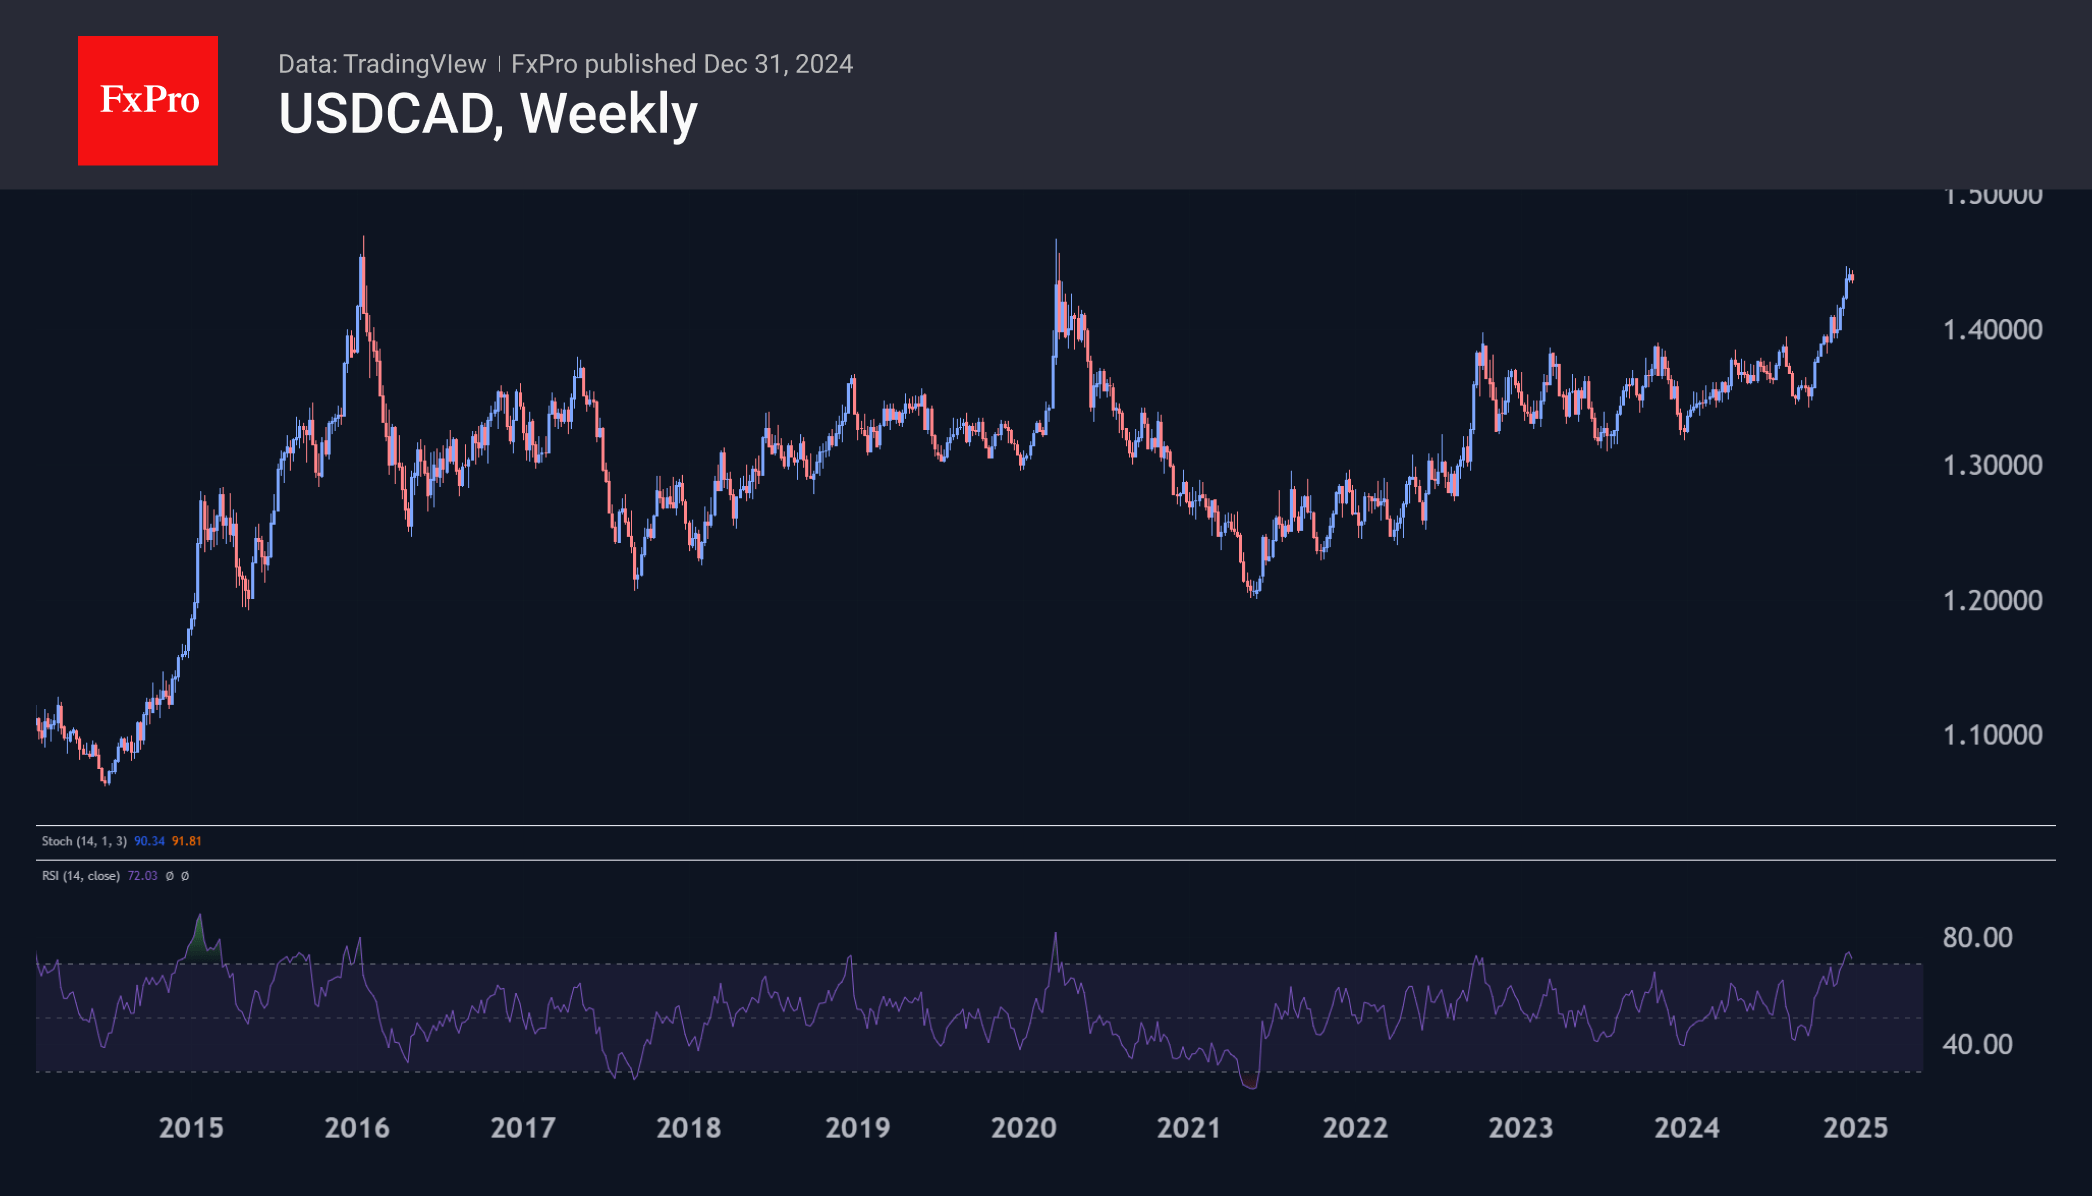
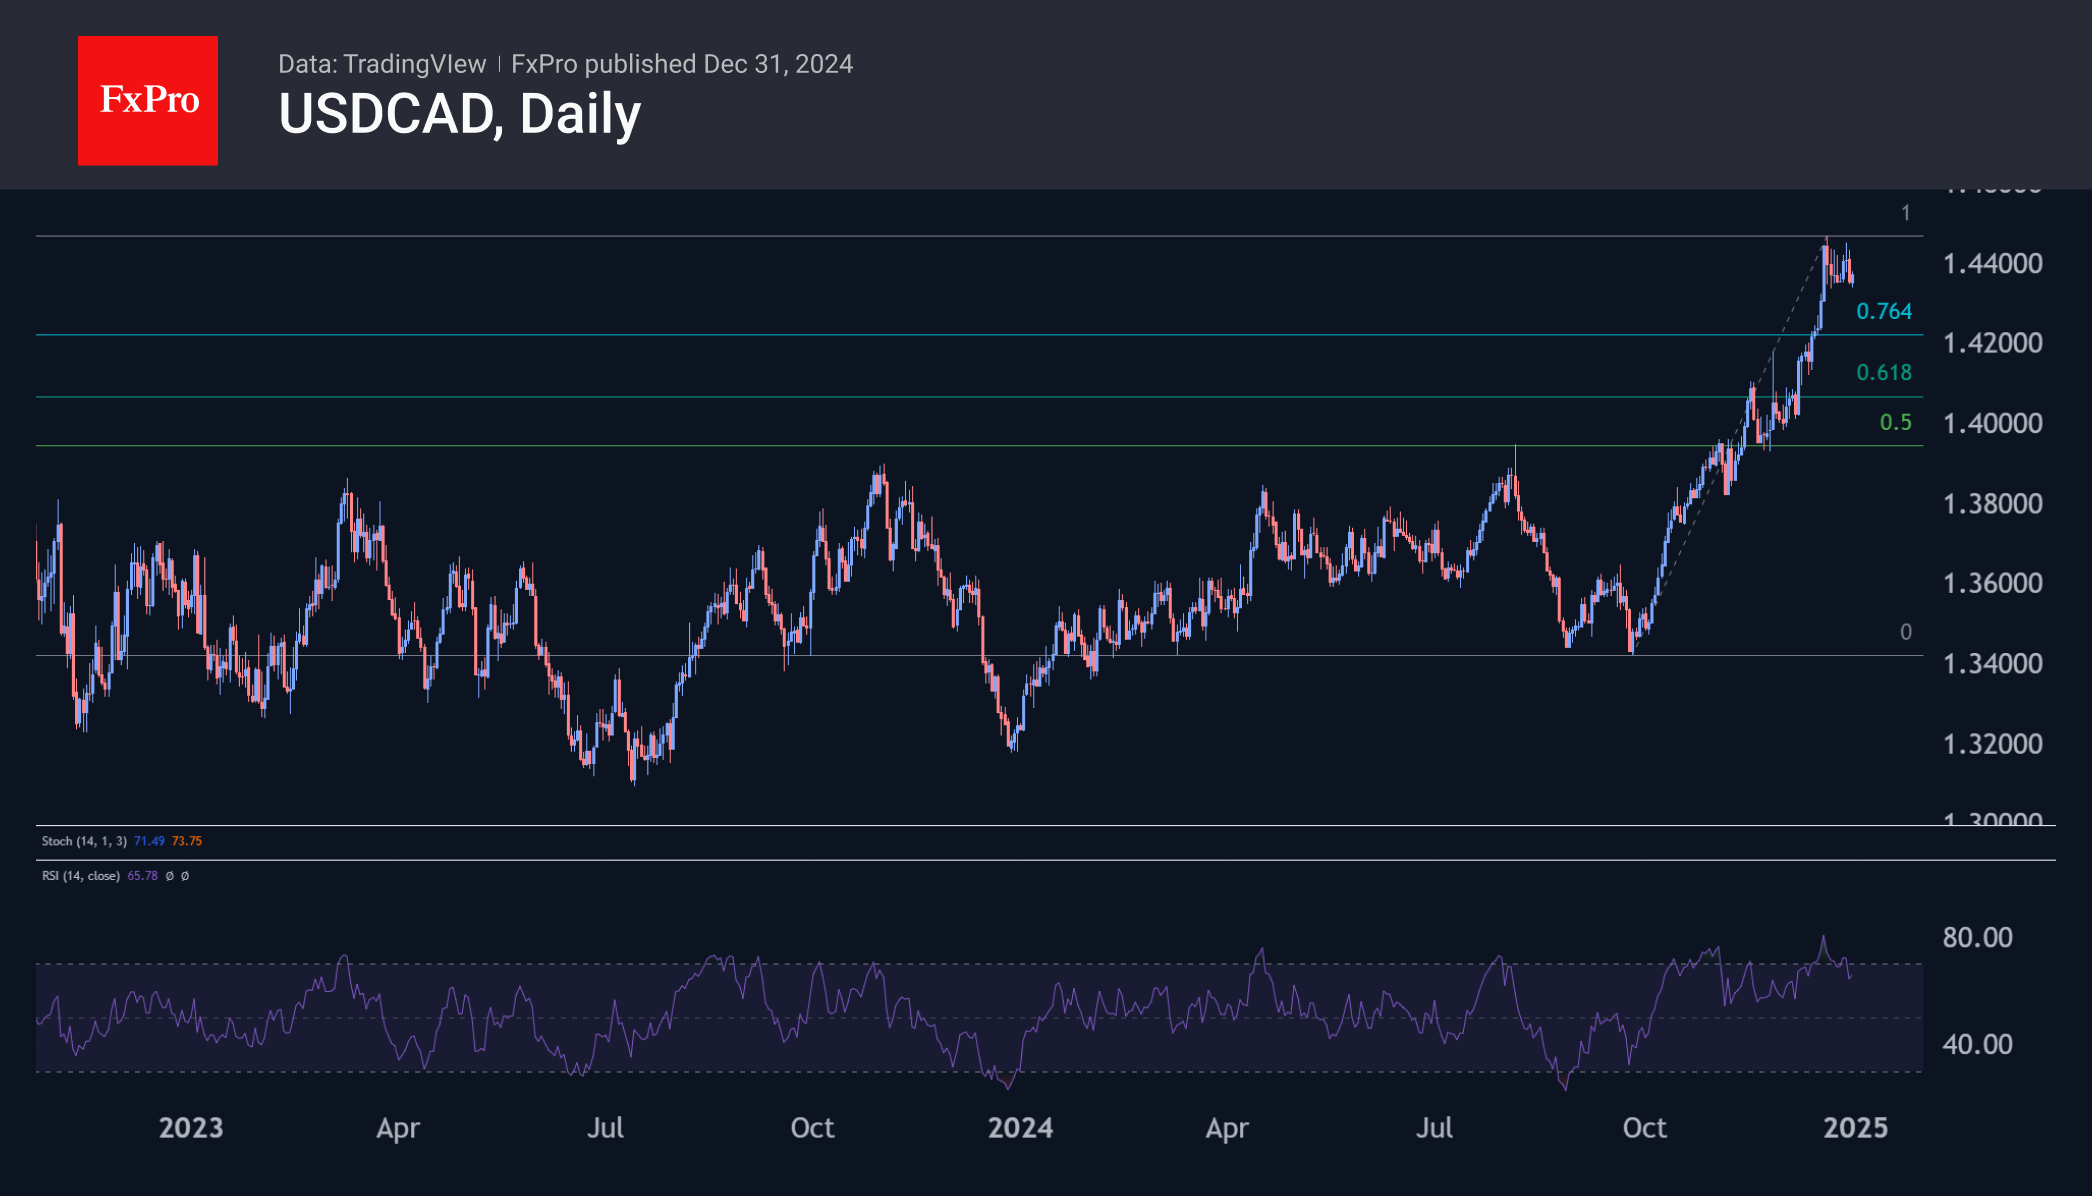
The USDCAD pair, which approached 1.45 in mid-December, is ending the year near 1.4350. The momentum of the last few days looks like a trend reversal, as there have been two unsuccessful attempts to storm the highs.

The upside momentum is losing strength after the extreme overbought conditions built up during the rally since September. The rally has been so extended that the RSI indicator on the weekly chart peaked at 75, only the third such episode in the last 10 years. In the previous two instances, the top was formed after oil.
This time, oil is smoothly forming a bottom, but it is already enough to stop the sell-off. Obviously, it is difficult for the market to push USDCAD higher without external support when the pair is already in multi-year extremes.

On the daily timeframe, USDCAD has reached overbought levels, with the RSI above 80, and the recent pullback indicates the start of a broad correction.
If we see a bottom in oil, this could attract buyers to the Canadian Dollar. The potential for a corrective pullback in USDCAD is around 2% from current levels to the 1.4080 area. The 50-day moving average and the upper boundary of the consolidation from the second half of November are now in place.
At the same time, history suggests that from such highs as we have seen in this pair, the chances of a long-term trend reversal, i.e. a return to the 1.34-1.38 area, are much higher.
The FxPro Analyst Team


