Key Indicator Shows Ripple (XRP) Price Could be on the Verge of a Rally
December 04, 2019 @ 13:01 +03:00

The majority of the Ripple (XRP) holders were waiting for the yearly Swell conference to bring some excitement to XRP price. However, the price didn’t move at all and now Ripple is searching for annual lows on its USD pair. The question is, was it reasonable for investors to expect a vast rally before the Swell conference or should they have not expected any upward movement at all?
The trend is quite clear and readers will notice that XRP price has continued to fall since the peak in January 2018. A downtrend is marked by lower highs and lower lows. Quite importantly, the price didn’t make any higher high since the peak in January 2018 and is still stuck in its downtrend. A positive is that there is a remarkably healthy support level of around $0.30. It took nearly a year until the floor broke downwards and this breakdown occurred in August 2019.
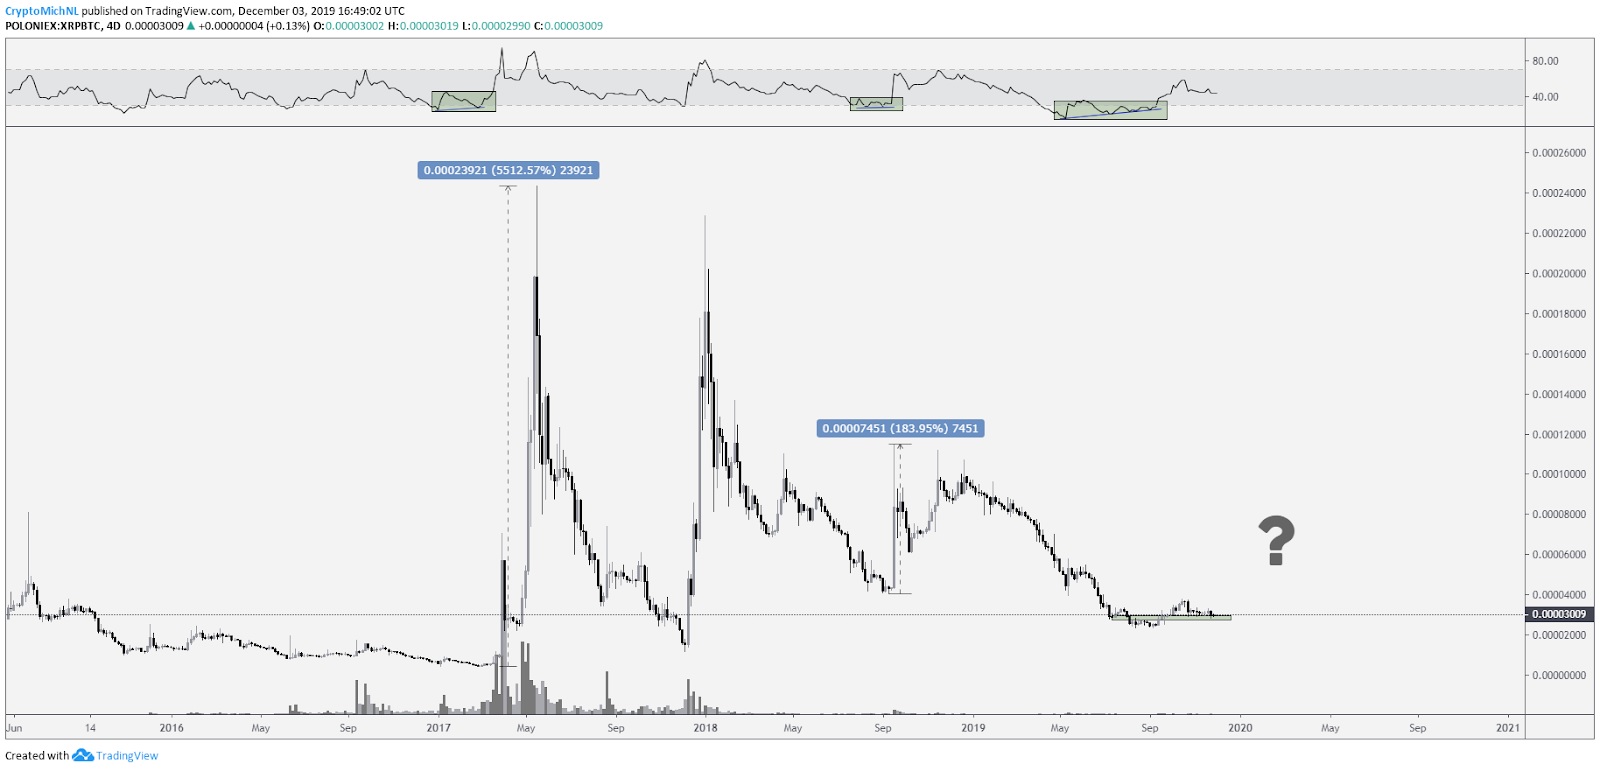
Alongside that, a potential falling wedge construction is found which is similar to the one seen on the left side of the chart. If the price can maintain this support and break to the upside, then a breakout towards 3700-3750 satoshis and possibly 4800-5000 satoshis is likely. The case of XRP price seeing a continuation to the upside is growing more likely according to the higher timeframes. The higher time frame charts (4-day in this example) are showing similar signals to prior bottom formations. The last time a bullish divergence occurred on the 4-day chart, the price surged 5,500% and 180%. A bullish divergence is not a guarantee of any price movements, but they are seen as one of the significant indicators for a potential trend reversal.


