


Has the U.S. stock market bubble started to blow?
October 27, 2020 @ 13:53 +03:00
U.S. indices were down by more than 3% during Monday. Although they were able to find buyer’s demand by the end of the session, the trend of slow decline has been in place for the past two weeks. At the same time, the U.S. broad market index, the S&P 500, is above its early year levels and even above its pre-pandemic peaks.
That is, companies are now more expensive than they were at the peak of the multi-year bull market when unemployment was at its lowest level in half a century and company profits were rising steadily.
The pandemic and lockdowns highlighted the advantages of individual companies for investors, which led to a rise in quotations, however, this does not cancel out the drop in revenues and profits. As a result, share price performance relative to earnings (P/E) was moving towards unsustainably high levels, which had previously only been seen during so-called bubble periods.
There is a risk that this new bubble will start to deflate as its growth drivers become exhausted. Part of the increase was due to temporary factors such as the interest of retail investors.
Players bought back the share price slump in the markets using savings saved on transport, restaurants, recreation, etc., as well as government support checks. But these stocks have probably run out or are now needed for other purposes. The S&P 500 treading water for the last two months could turn some speculators away from it. They expect returns to arrive quickly based on the thought that “stocks can only go up”.

Worse than this, American lawmakers are now discussing the details of a support package much more fiercely, having not been able to accept it since August.
There are also questions surrounding institutional demand. Some investors are paying attention to falling company revenues and overpriced stocks relative to average levels.
Of course, many of them have to select stocks against the backdrop of a collapse in government bond yields. However, there are opportunities for geographical and asset classes diversification.
Bubbles tend to burst in two ways; The first is a very sharp collapse, similar to what we saw in spring or at the height of the global financial crisis.
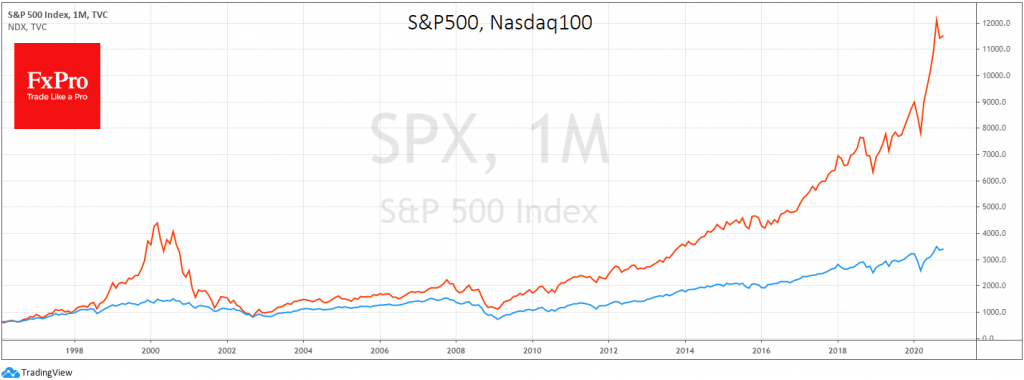
Alternatively, the bubble may deflate smoothly, as was witnessed after the dot-com crisis. For three years, the main indices were falling, and the Nasdaq Composite performed even worse than others.
Between 1995 and 2000, its growth dragged stocks upwards, and then between 2000 and 2003, it carried stocks downwards. This is an analogy that plays into the current times.
An important common feature (apart from the hype around online companies and services) is the public’s great interest in the stock market. After three years of falling indices, people have long been disappointed in stock markets, and a new discontent is probably not far off.
In this case, in the coming days and weeks, we will see how investors will start to buy back the short-term drawdown, but that is not enough to push the indices back up.
Right now, the S&P 500 is testing support at a 50-day average at 3400. Short-term buyers are still able to keep the index from sinking deeper. In the event of a failure, we will have to see another test in the form of a 200-day average, which is now passing through 3130. It only makes sense to sound the alarm if this line of defence fails, indicating the sentiment of longer-term investors.
The FxPro Analyst Team