Gold is correcting, not reversing. Here’s why
July 25, 2023 @ 16:36 +03:00
The US dollar has risen for the 6th consecutive session, weighing on gold. However, this corrective pullback now highlights gold’s internal strength.

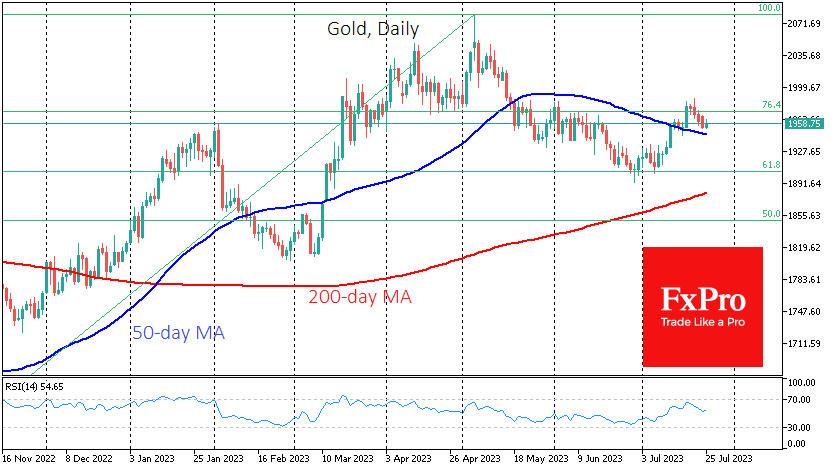
Over the last week, gold fell 1.2% to $1953, erasing the rally of the 18th. However, longer declines than gains point to buyers on the downside. It’s also worth noting that the dollar index is up 1.7% over the same period, although gold tends to move with greater amplitude.
Earlier this month, gold reversed to the upside following a pullback to the 61.8% Fibonacci line from the rally from the November lows to the early May peak. When fully completed, this classic pattern offers an upside potential of $2370 (161.8% of the initial move).
Exactly a week ago, the market confirmed this bullish sentiment by climbing steadily higher and breaking above the 50-day moving average. Despite this week’s decline, gold remains above this important curve and is still formally in a bullish trend.
Given the prospects for further declines, a dynamic near $1947 and $1910 will be necessary. A break below the former would take gold back below its 50-day moving average, and a break above it could be seen as a false break.
A break below $1910 will take the price below the previous local lows. Combined with the lower local highs from mid-July, this would form a downtrend, trashing the current bullish scenario.

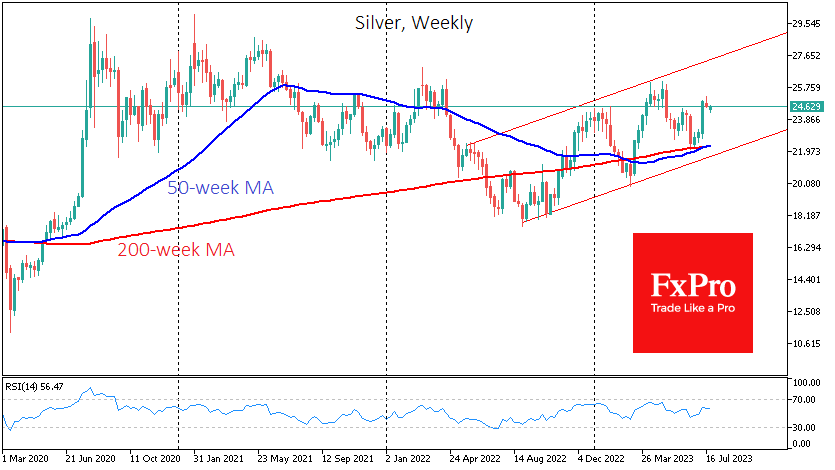
The bullish case for gold is also supported by the performance of silver, which rallied 12% from its late June lows before correcting 3%. A “golden cross” has formed on the weekly chart: The 50-week average rose above the 200-week average. For reference, gold has been in this mode since 2017.
The current situation allows traders to expect more decisive bullish momentum from Silver but also serves as an additional bullish indicator for Gold.
The FxPro Analyst Team


